Colombian vs Laotian Female Poverty
COMPARE
Colombian
Laotian
Female Poverty
Female Poverty Comparison
Colombians
Laotians
13.4%
FEMALE POVERTY
55.7/ 100
METRIC RATING
170th/ 347
METRIC RANK
12.6%
FEMALE POVERTY
93.4/ 100
METRIC RATING
107th/ 347
METRIC RANK
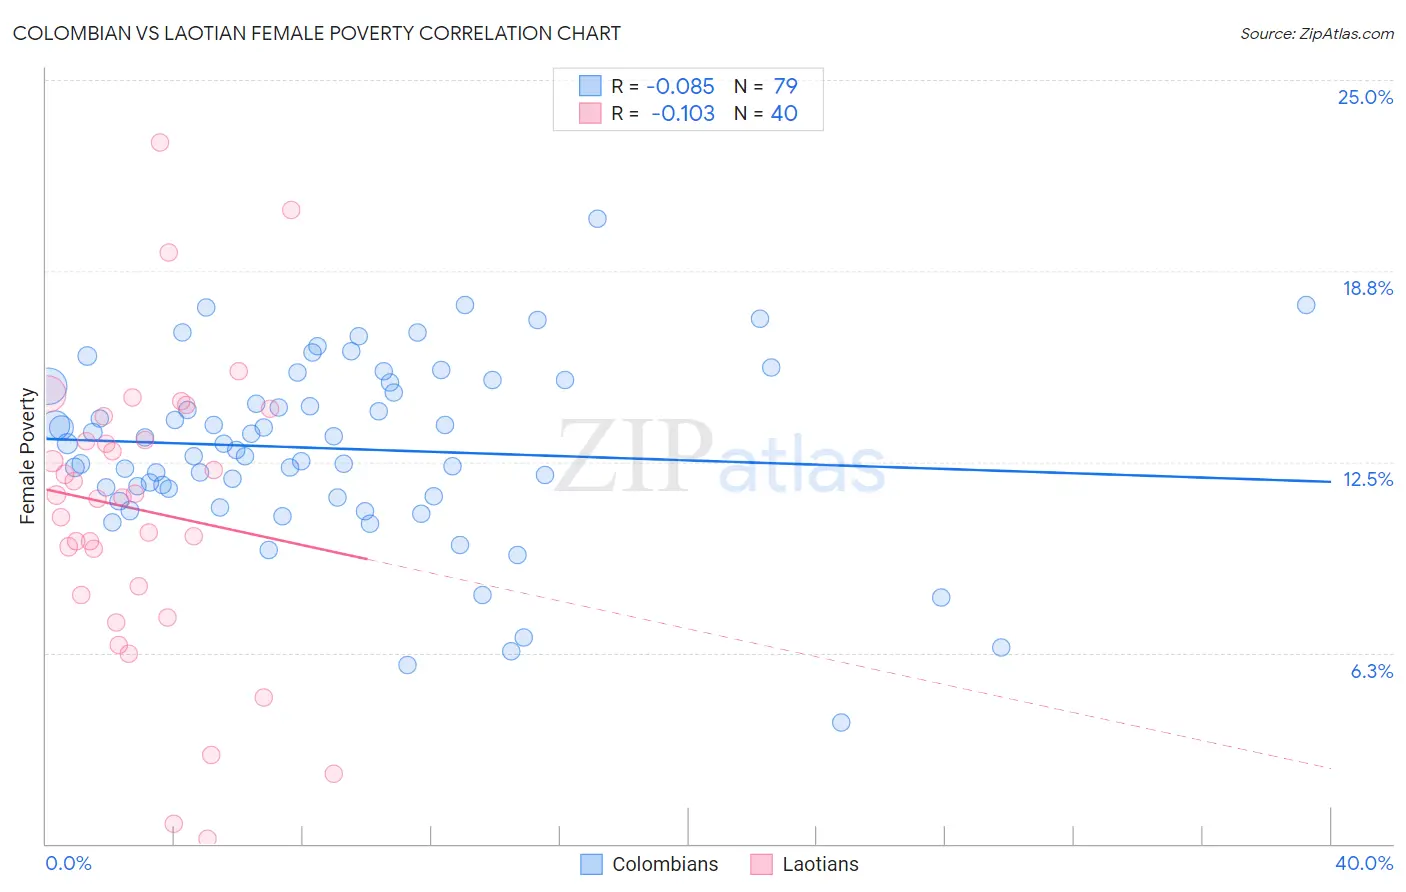
Colombian vs Laotian Female Poverty Correlation Chart
The statistical analysis conducted on geographies consisting of 419,235,280 people shows a slight negative correlation between the proportion of Colombians and poverty level among females in the United States with a correlation coefficient (R) of -0.085 and weighted average of 13.4%. Similarly, the statistical analysis conducted on geographies consisting of 224,727,554 people shows a poor negative correlation between the proportion of Laotians and poverty level among females in the United States with a correlation coefficient (R) of -0.103 and weighted average of 12.6%, a difference of 6.2%.
Female Poverty Correlation Summary
| Measurement | Colombian | Laotian |
| Minimum | 4.0% | 0.15% |
| Maximum | 20.5% | 22.9% |
| Range | 16.5% | 22.8% |
| Mean | 12.9% | 10.9% |
| Median | 13.1% | 11.4% |
| Interquartile 25% (IQ1) | 11.4% | 8.3% |
| Interquartile 75% (IQ3) | 15.1% | 13.6% |
| Interquartile Range (IQR) | 3.7% | 5.3% |
| Standard Deviation (Sample) | 3.0% | 4.8% |
| Standard Deviation (Population) | 3.0% | 4.8% |
Similar Demographics by Female Poverty
Demographics Similar to Colombians by Female Poverty
In terms of female poverty, the demographic groups most similar to Colombians are Lebanese (13.4%, a difference of 0.020%), Aleut (13.4%, a difference of 0.10%), White/Caucasian (13.4%, a difference of 0.11%), Immigrants from Chile (13.3%, a difference of 0.16%), and Mongolian (13.4%, a difference of 0.21%).
| Demographics | Rating | Rank | Female Poverty |
| Immigrants | Albania | 62.4 /100 | #163 | Good 13.3% |
| Ethiopians | 62.3 /100 | #164 | Good 13.3% |
| Scotch-Irish | 62.1 /100 | #165 | Good 13.3% |
| Immigrants | Oceania | 59.7 /100 | #166 | Average 13.3% |
| Immigrants | Chile | 57.4 /100 | #167 | Average 13.3% |
| Aleuts | 56.7 /100 | #168 | Average 13.4% |
| Lebanese | 55.9 /100 | #169 | Average 13.4% |
| Colombians | 55.7 /100 | #170 | Average 13.4% |
| Whites/Caucasians | 54.6 /100 | #171 | Average 13.4% |
| Mongolians | 53.6 /100 | #172 | Average 13.4% |
| Immigrants | Afghanistan | 50.8 /100 | #173 | Average 13.4% |
| Immigrants | Iraq | 50.0 /100 | #174 | Average 13.4% |
| Celtics | 49.9 /100 | #175 | Average 13.4% |
| Immigrants | Spain | 49.9 /100 | #176 | Average 13.4% |
| Immigrants | Morocco | 49.4 /100 | #177 | Average 13.4% |
Demographics Similar to Laotians by Female Poverty
In terms of female poverty, the demographic groups most similar to Laotians are Portuguese (12.6%, a difference of 0.10%), Immigrants from Zimbabwe (12.6%, a difference of 0.12%), Paraguayan (12.6%, a difference of 0.15%), Immigrants from Turkey (12.6%, a difference of 0.19%), and Scottish (12.5%, a difference of 0.31%).
| Demographics | Rating | Rank | Female Poverty |
| Immigrants | Latvia | 94.8 /100 | #100 | Exceptional 12.5% |
| Tlingit-Haida | 94.8 /100 | #101 | Exceptional 12.5% |
| Immigrants | China | 94.5 /100 | #102 | Exceptional 12.5% |
| Slavs | 94.5 /100 | #103 | Exceptional 12.5% |
| Palestinians | 94.3 /100 | #104 | Exceptional 12.5% |
| Scottish | 94.1 /100 | #105 | Exceptional 12.5% |
| Immigrants | Turkey | 93.8 /100 | #106 | Exceptional 12.6% |
| Laotians | 93.4 /100 | #107 | Exceptional 12.6% |
| Portuguese | 93.1 /100 | #108 | Exceptional 12.6% |
| Immigrants | Zimbabwe | 93.1 /100 | #109 | Exceptional 12.6% |
| Paraguayans | 93.0 /100 | #110 | Exceptional 12.6% |
| Soviet Union | 92.4 /100 | #111 | Exceptional 12.6% |
| Immigrants | Israel | 92.0 /100 | #112 | Exceptional 12.6% |
| Canadians | 92.0 /100 | #113 | Exceptional 12.7% |
| Welsh | 91.6 /100 | #114 | Exceptional 12.7% |