Immigrants from Guyana vs Immigrants from West Indies Female Poverty
COMPARE
Immigrants from Guyana
Immigrants from West Indies
Female Poverty
Female Poverty Comparison
Immigrants from Guyana
Immigrants from West Indies
15.6%
FEMALE POVERTY
0.1/ 100
METRIC RATING
260th/ 347
METRIC RANK
16.1%
FEMALE POVERTY
0.0/ 100
METRIC RATING
278th/ 347
METRIC RANK
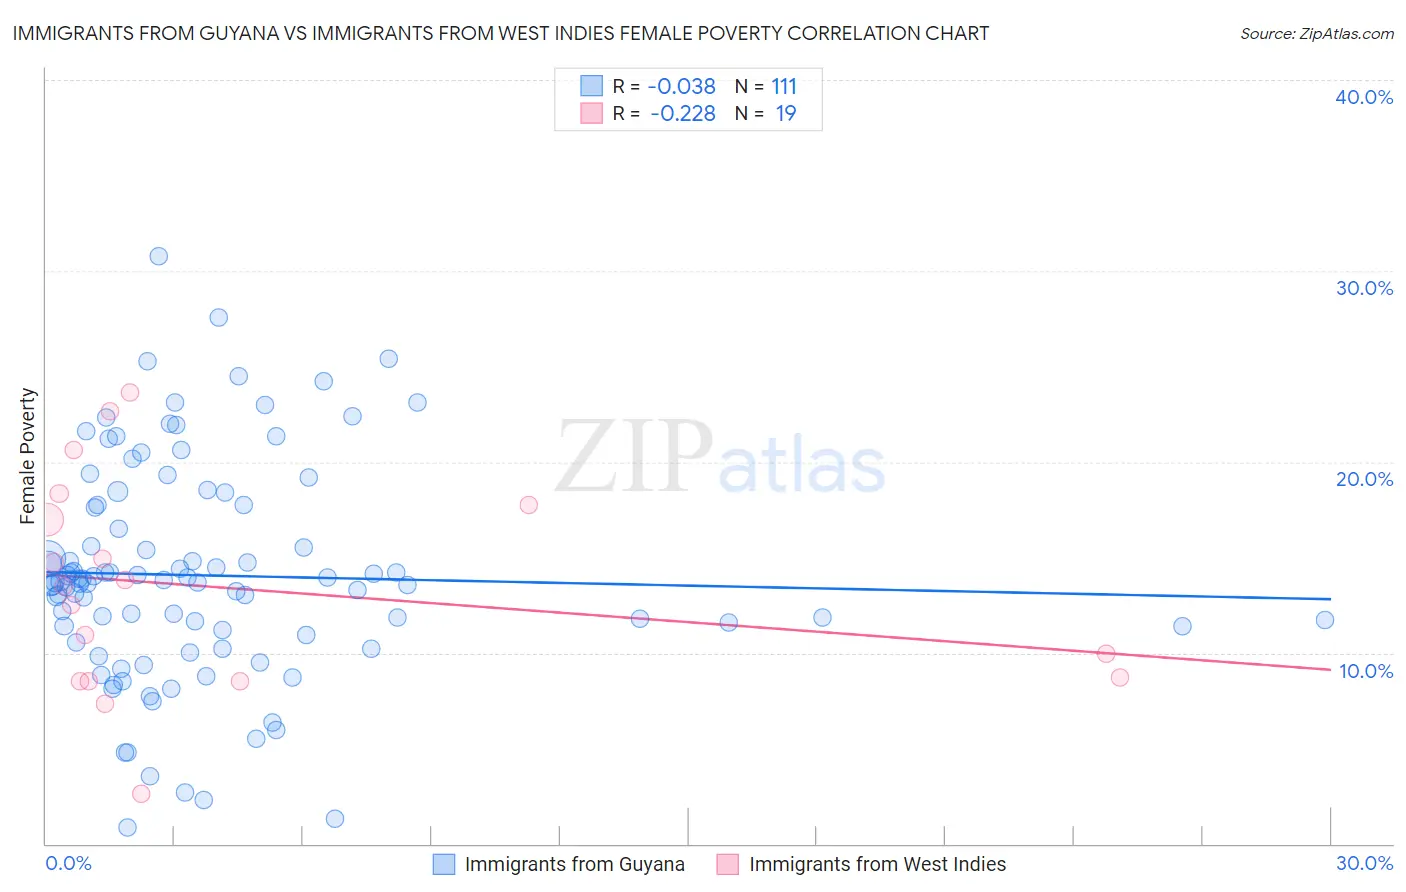
Immigrants from Guyana vs Immigrants from West Indies Female Poverty Correlation Chart
The statistical analysis conducted on geographies consisting of 183,633,406 people shows no correlation between the proportion of Immigrants from Guyana and poverty level among females in the United States with a correlation coefficient (R) of -0.038 and weighted average of 15.6%. Similarly, the statistical analysis conducted on geographies consisting of 72,454,628 people shows a weak negative correlation between the proportion of Immigrants from West Indies and poverty level among females in the United States with a correlation coefficient (R) of -0.228 and weighted average of 16.1%, a difference of 2.9%.
Female Poverty Correlation Summary
| Measurement | Immigrants from Guyana | Immigrants from West Indies |
| Minimum | 0.82% | 2.6% |
| Maximum | 30.8% | 23.6% |
| Range | 30.0% | 21.0% |
| Mean | 14.1% | 13.4% |
| Median | 13.7% | 13.5% |
| Interquartile 25% (IQ1) | 10.9% | 8.5% |
| Interquartile 75% (IQ3) | 17.7% | 17.7% |
| Interquartile Range (IQR) | 6.8% | 9.2% |
| Standard Deviation (Sample) | 5.7% | 5.6% |
| Standard Deviation (Population) | 5.7% | 5.5% |
Demographics Similar to Immigrants from Guyana and Immigrants from West Indies by Female Poverty
In terms of female poverty, the demographic groups most similar to Immigrants from Guyana are Cape Verdean (15.6%, a difference of 0.080%), Guyanese (15.6%, a difference of 0.10%), Mexican American Indian (15.6%, a difference of 0.10%), Cherokee (15.6%, a difference of 0.11%), and Immigrants from Ecuador (15.6%, a difference of 0.24%). Similarly, the demographic groups most similar to Immigrants from West Indies are Immigrants from Bahamas (16.1%, a difference of 0.12%), Bangladeshi (16.0%, a difference of 0.31%), Central American (16.0%, a difference of 0.50%), Immigrants from Barbados (16.0%, a difference of 0.62%), and Haitian (15.9%, a difference of 0.69%).
| Demographics | Rating | Rank | Female Poverty |
| Cape Verdeans | 0.1 /100 | #259 | Tragic 15.6% |
| Immigrants | Guyana | 0.1 /100 | #260 | Tragic 15.6% |
| Guyanese | 0.1 /100 | #261 | Tragic 15.6% |
| Mexican American Indians | 0.1 /100 | #262 | Tragic 15.6% |
| Cherokee | 0.1 /100 | #263 | Tragic 15.6% |
| Immigrants | Ecuador | 0.1 /100 | #264 | Tragic 15.6% |
| Immigrants | Liberia | 0.1 /100 | #265 | Tragic 15.7% |
| Immigrants | El Salvador | 0.1 /100 | #266 | Tragic 15.7% |
| Sub-Saharan Africans | 0.1 /100 | #267 | Tragic 15.8% |
| Immigrants | Nicaragua | 0.1 /100 | #268 | Tragic 15.8% |
| Iroquois | 0.1 /100 | #269 | Tragic 15.8% |
| Chickasaw | 0.1 /100 | #270 | Tragic 15.9% |
| Immigrants | St. Vincent and the Grenadines | 0.0 /100 | #271 | Tragic 15.9% |
| Belizeans | 0.0 /100 | #272 | Tragic 15.9% |
| Haitians | 0.0 /100 | #273 | Tragic 15.9% |
| Barbadians | 0.0 /100 | #274 | Tragic 15.9% |
| Immigrants | Barbados | 0.0 /100 | #275 | Tragic 16.0% |
| Central Americans | 0.0 /100 | #276 | Tragic 16.0% |
| Bangladeshis | 0.0 /100 | #277 | Tragic 16.0% |
| Immigrants | West Indies | 0.0 /100 | #278 | Tragic 16.1% |
| Immigrants | Bahamas | 0.0 /100 | #279 | Tragic 16.1% |