Colville vs Laotian Female Poverty
COMPARE
Colville
Laotian
Female Poverty
Female Poverty Comparison
Colville
Laotians
17.8%
FEMALE POVERTY
0.0/ 100
METRIC RATING
325th/ 347
METRIC RANK
12.6%
FEMALE POVERTY
93.4/ 100
METRIC RATING
107th/ 347
METRIC RANK
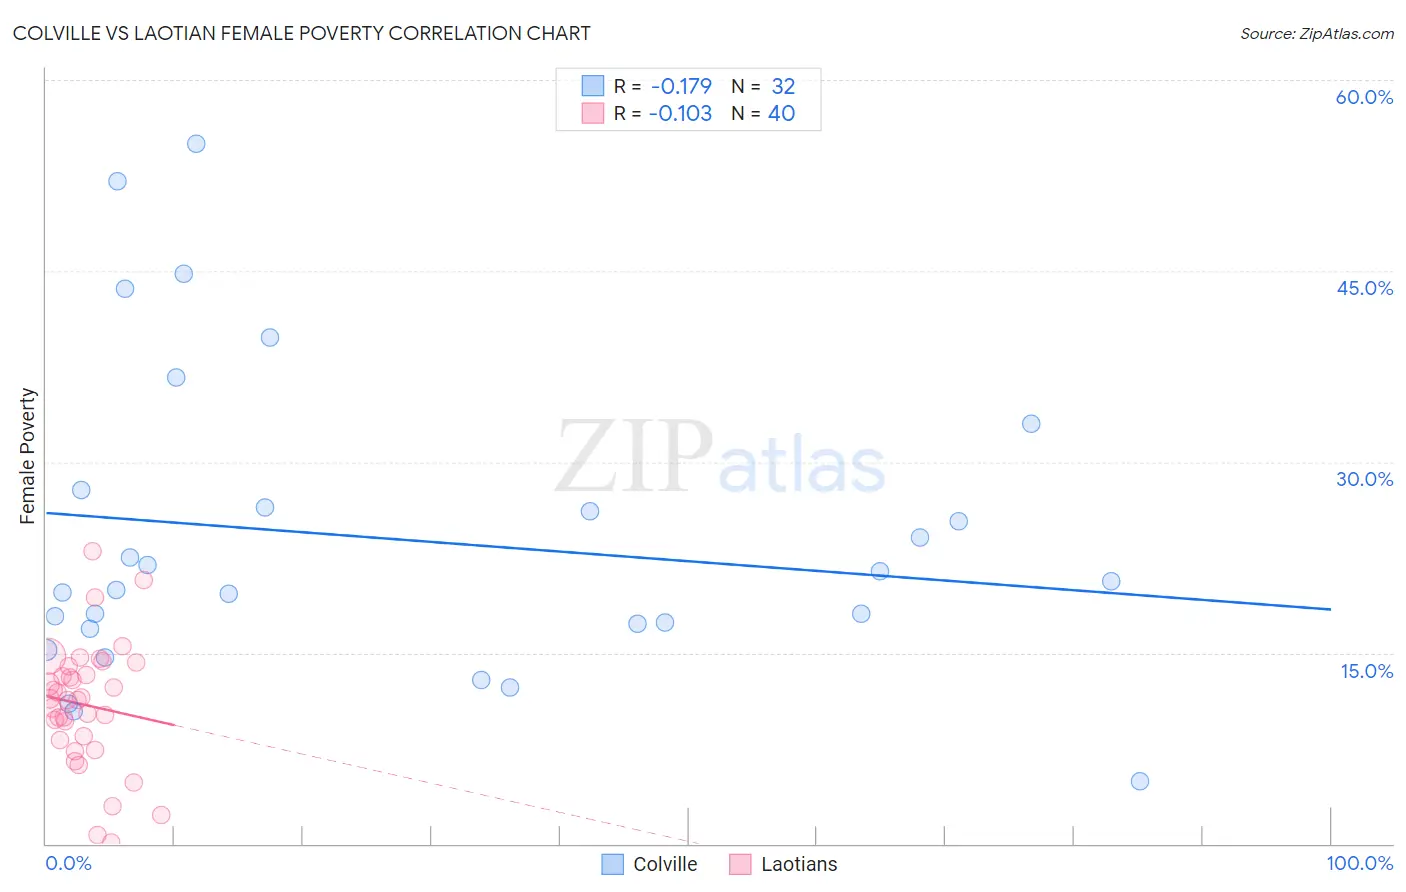
Colville vs Laotian Female Poverty Correlation Chart
The statistical analysis conducted on geographies consisting of 34,683,494 people shows a poor negative correlation between the proportion of Colville and poverty level among females in the United States with a correlation coefficient (R) of -0.179 and weighted average of 17.8%. Similarly, the statistical analysis conducted on geographies consisting of 224,727,554 people shows a poor negative correlation between the proportion of Laotians and poverty level among females in the United States with a correlation coefficient (R) of -0.103 and weighted average of 12.6%, a difference of 41.1%.
Female Poverty Correlation Summary
| Measurement | Colville | Laotian |
| Minimum | 4.9% | 0.15% |
| Maximum | 55.0% | 22.9% |
| Range | 50.1% | 22.8% |
| Mean | 24.0% | 10.9% |
| Median | 20.3% | 11.4% |
| Interquartile 25% (IQ1) | 17.1% | 8.3% |
| Interquartile 75% (IQ3) | 27.1% | 13.6% |
| Interquartile Range (IQR) | 10.0% | 5.3% |
| Standard Deviation (Sample) | 12.1% | 4.8% |
| Standard Deviation (Population) | 11.9% | 4.8% |
Similar Demographics by Female Poverty
Demographics Similar to Colville by Female Poverty
In terms of female poverty, the demographic groups most similar to Colville are Immigrants from Honduras (17.7%, a difference of 0.15%), Paiute (17.7%, a difference of 0.34%), Menominee (17.6%, a difference of 0.93%), Central American Indian (18.0%, a difference of 1.5%), and Arapaho (17.5%, a difference of 1.6%).
| Demographics | Rating | Rank | Female Poverty |
| Ute | 0.0 /100 | #318 | Tragic 17.5% |
| Cajuns | 0.0 /100 | #319 | Tragic 17.5% |
| Immigrants | Dominica | 0.0 /100 | #320 | Tragic 17.5% |
| Arapaho | 0.0 /100 | #321 | Tragic 17.5% |
| Menominee | 0.0 /100 | #322 | Tragic 17.6% |
| Paiute | 0.0 /100 | #323 | Tragic 17.7% |
| Immigrants | Honduras | 0.0 /100 | #324 | Tragic 17.7% |
| Colville | 0.0 /100 | #325 | Tragic 17.8% |
| Central American Indians | 0.0 /100 | #326 | Tragic 18.0% |
| Yakama | 0.0 /100 | #327 | Tragic 18.0% |
| Blacks/African Americans | 0.0 /100 | #328 | Tragic 18.6% |
| Kiowa | 0.0 /100 | #329 | Tragic 18.6% |
| Dominicans | 0.0 /100 | #330 | Tragic 19.1% |
| Natives/Alaskans | 0.0 /100 | #331 | Tragic 19.2% |
| Apache | 0.0 /100 | #332 | Tragic 19.2% |
Demographics Similar to Laotians by Female Poverty
In terms of female poverty, the demographic groups most similar to Laotians are Portuguese (12.6%, a difference of 0.10%), Immigrants from Zimbabwe (12.6%, a difference of 0.12%), Paraguayan (12.6%, a difference of 0.15%), Immigrants from Turkey (12.6%, a difference of 0.19%), and Scottish (12.5%, a difference of 0.31%).
| Demographics | Rating | Rank | Female Poverty |
| Immigrants | Latvia | 94.8 /100 | #100 | Exceptional 12.5% |
| Tlingit-Haida | 94.8 /100 | #101 | Exceptional 12.5% |
| Immigrants | China | 94.5 /100 | #102 | Exceptional 12.5% |
| Slavs | 94.5 /100 | #103 | Exceptional 12.5% |
| Palestinians | 94.3 /100 | #104 | Exceptional 12.5% |
| Scottish | 94.1 /100 | #105 | Exceptional 12.5% |
| Immigrants | Turkey | 93.8 /100 | #106 | Exceptional 12.6% |
| Laotians | 93.4 /100 | #107 | Exceptional 12.6% |
| Portuguese | 93.1 /100 | #108 | Exceptional 12.6% |
| Immigrants | Zimbabwe | 93.1 /100 | #109 | Exceptional 12.6% |
| Paraguayans | 93.0 /100 | #110 | Exceptional 12.6% |
| Soviet Union | 92.4 /100 | #111 | Exceptional 12.6% |
| Immigrants | Israel | 92.0 /100 | #112 | Exceptional 12.6% |
| Canadians | 92.0 /100 | #113 | Exceptional 12.7% |
| Welsh | 91.6 /100 | #114 | Exceptional 12.7% |