Immigrants from Guyana vs Alaska Native Female Poverty
COMPARE
Immigrants from Guyana
Alaska Native
Female Poverty
Female Poverty Comparison
Immigrants from Guyana
Alaska Natives
15.6%
FEMALE POVERTY
0.1/ 100
METRIC RATING
260th/ 347
METRIC RANK
14.7%
FEMALE POVERTY
1.8/ 100
METRIC RATING
230th/ 347
METRIC RANK
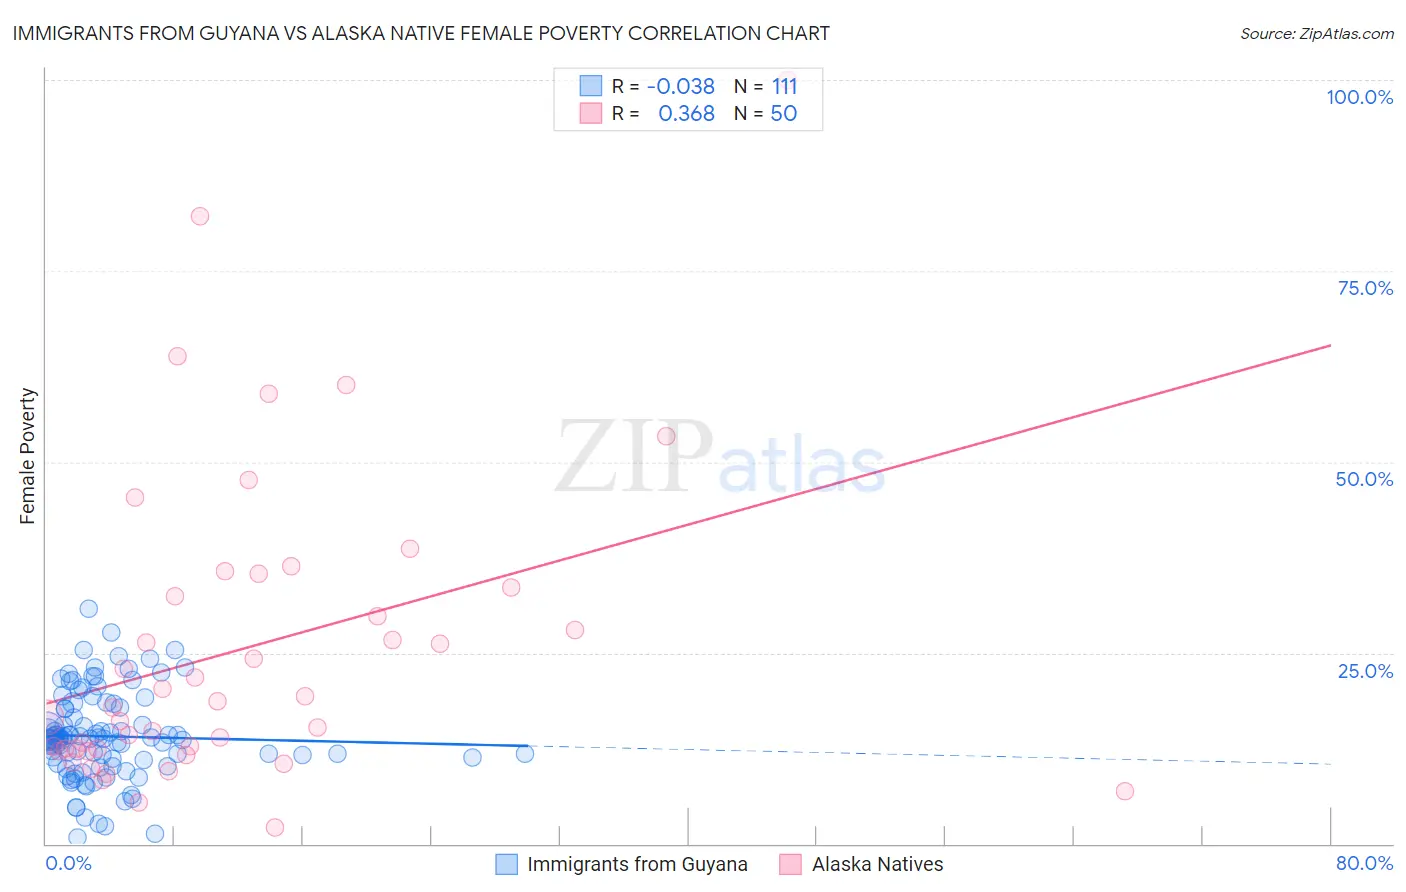
Immigrants from Guyana vs Alaska Native Female Poverty Correlation Chart
The statistical analysis conducted on geographies consisting of 183,633,406 people shows no correlation between the proportion of Immigrants from Guyana and poverty level among females in the United States with a correlation coefficient (R) of -0.038 and weighted average of 15.6%. Similarly, the statistical analysis conducted on geographies consisting of 76,751,650 people shows a mild positive correlation between the proportion of Alaska Natives and poverty level among females in the United States with a correlation coefficient (R) of 0.368 and weighted average of 14.7%, a difference of 5.8%.
Female Poverty Correlation Summary
| Measurement | Immigrants from Guyana | Alaska Native |
| Minimum | 0.82% | 2.1% |
| Maximum | 30.8% | 100.0% |
| Range | 30.0% | 97.9% |
| Mean | 14.1% | 25.6% |
| Median | 13.7% | 18.2% |
| Interquartile 25% (IQ1) | 10.9% | 12.4% |
| Interquartile 75% (IQ3) | 17.7% | 33.6% |
| Interquartile Range (IQR) | 6.8% | 21.2% |
| Standard Deviation (Sample) | 5.7% | 20.2% |
| Standard Deviation (Population) | 5.7% | 20.0% |
Similar Demographics by Female Poverty
Demographics Similar to Immigrants from Guyana by Female Poverty
In terms of female poverty, the demographic groups most similar to Immigrants from Guyana are Cape Verdean (15.6%, a difference of 0.080%), Guyanese (15.6%, a difference of 0.10%), Mexican American Indian (15.6%, a difference of 0.10%), Cherokee (15.6%, a difference of 0.11%), and Shoshone (15.6%, a difference of 0.19%).
| Demographics | Rating | Rank | Female Poverty |
| Liberians | 0.2 /100 | #253 | Tragic 15.4% |
| Trinidadians and Tobagonians | 0.2 /100 | #254 | Tragic 15.4% |
| Ottawa | 0.2 /100 | #255 | Tragic 15.5% |
| Jamaicans | 0.2 /100 | #256 | Tragic 15.5% |
| Immigrants | Jamaica | 0.1 /100 | #257 | Tragic 15.6% |
| Shoshone | 0.1 /100 | #258 | Tragic 15.6% |
| Cape Verdeans | 0.1 /100 | #259 | Tragic 15.6% |
| Immigrants | Guyana | 0.1 /100 | #260 | Tragic 15.6% |
| Guyanese | 0.1 /100 | #261 | Tragic 15.6% |
| Mexican American Indians | 0.1 /100 | #262 | Tragic 15.6% |
| Cherokee | 0.1 /100 | #263 | Tragic 15.6% |
| Immigrants | Ecuador | 0.1 /100 | #264 | Tragic 15.6% |
| Immigrants | Liberia | 0.1 /100 | #265 | Tragic 15.7% |
| Immigrants | El Salvador | 0.1 /100 | #266 | Tragic 15.7% |
| Sub-Saharan Africans | 0.1 /100 | #267 | Tragic 15.8% |
Demographics Similar to Alaska Natives by Female Poverty
In terms of female poverty, the demographic groups most similar to Alaska Natives are Nigerian (14.8%, a difference of 0.10%), Ghanaian (14.7%, a difference of 0.20%), German Russian (14.7%, a difference of 0.27%), Immigrants from Nigeria (14.7%, a difference of 0.41%), and Osage (14.8%, a difference of 0.41%).
| Demographics | Rating | Rank | Female Poverty |
| Immigrants | Africa | 3.3 /100 | #223 | Tragic 14.5% |
| Americans | 2.8 /100 | #224 | Tragic 14.6% |
| Immigrants | Micronesia | 2.8 /100 | #225 | Tragic 14.6% |
| Immigrants | Eritrea | 2.4 /100 | #226 | Tragic 14.6% |
| Immigrants | Nigeria | 2.1 /100 | #227 | Tragic 14.7% |
| German Russians | 2.0 /100 | #228 | Tragic 14.7% |
| Ghanaians | 1.9 /100 | #229 | Tragic 14.7% |
| Alaska Natives | 1.8 /100 | #230 | Tragic 14.7% |
| Nigerians | 1.7 /100 | #231 | Tragic 14.8% |
| Osage | 1.5 /100 | #232 | Tragic 14.8% |
| Immigrants | Saudi Arabia | 1.4 /100 | #233 | Tragic 14.8% |
| Fijians | 1.1 /100 | #234 | Tragic 14.9% |
| Immigrants | Laos | 0.9 /100 | #235 | Tragic 15.0% |
| Cree | 0.7 /100 | #236 | Tragic 15.1% |
| French American Indians | 0.6 /100 | #237 | Tragic 15.1% |