Immigrants from Guyana vs German Poverty
COMPARE
Immigrants from Guyana
German
Poverty
Poverty Comparison
Immigrants from Guyana
Germans
14.5%
POVERTY
0.1/ 100
METRIC RATING
265th/ 347
METRIC RANK
11.1%
POVERTY
98.1/ 100
METRIC RATING
58th/ 347
METRIC RANK
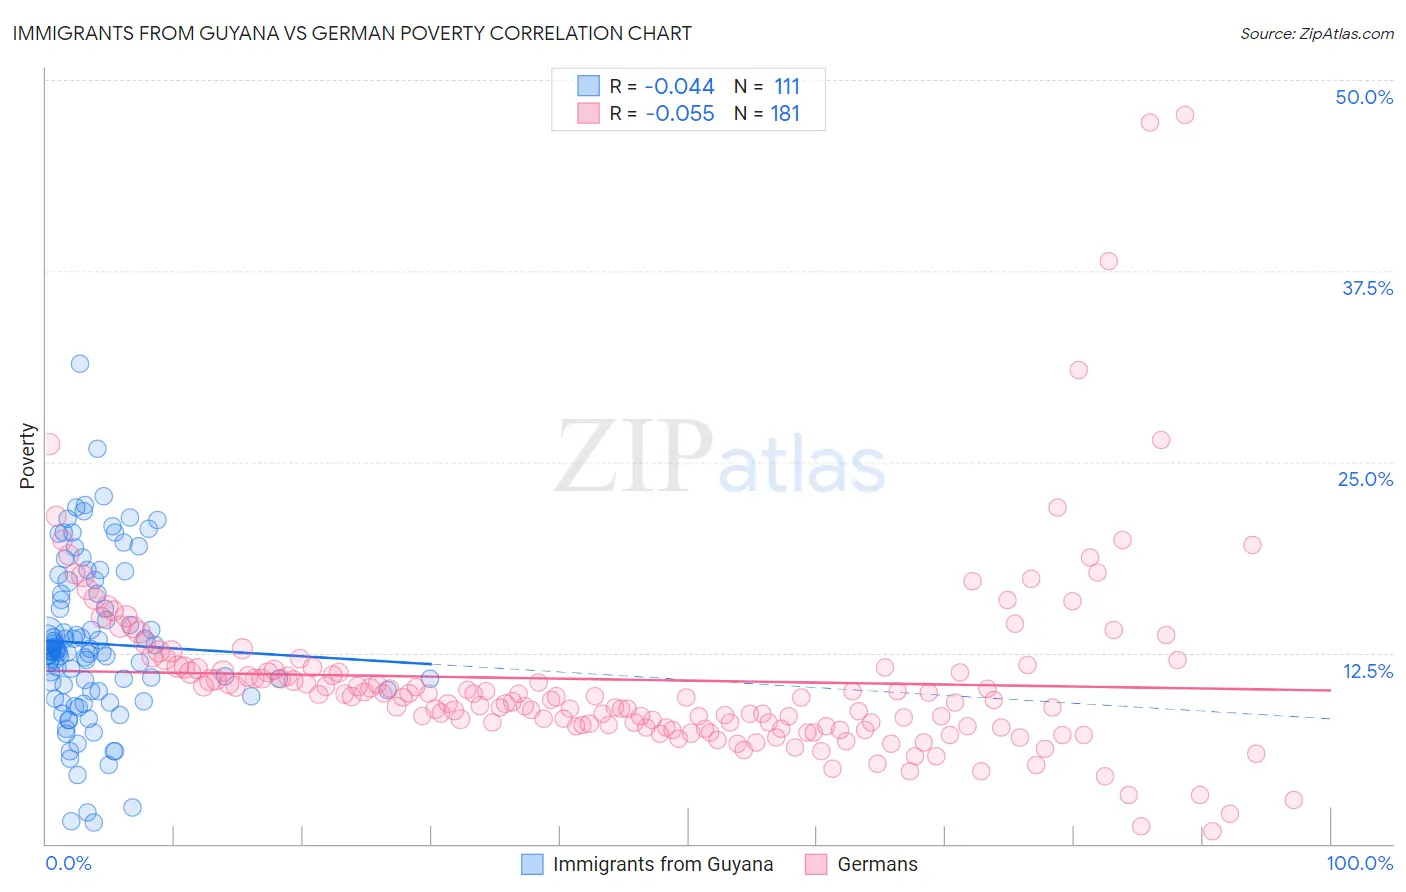
Immigrants from Guyana vs German Poverty Correlation Chart
The statistical analysis conducted on geographies consisting of 183,648,527 people shows no correlation between the proportion of Immigrants from Guyana and poverty level in the United States with a correlation coefficient (R) of -0.044 and weighted average of 14.5%. Similarly, the statistical analysis conducted on geographies consisting of 580,012,247 people shows a slight negative correlation between the proportion of Germans and poverty level in the United States with a correlation coefficient (R) of -0.055 and weighted average of 11.1%, a difference of 29.8%.
Poverty Correlation Summary
| Measurement | Immigrants from Guyana | German |
| Minimum | 1.4% | 0.84% |
| Maximum | 31.4% | 47.7% |
| Range | 30.0% | 46.9% |
| Mean | 13.1% | 10.7% |
| Median | 12.6% | 9.6% |
| Interquartile 25% (IQ1) | 10.0% | 7.7% |
| Interquartile 75% (IQ3) | 16.4% | 11.5% |
| Interquartile Range (IQR) | 6.4% | 3.8% |
| Standard Deviation (Sample) | 5.3% | 6.2% |
| Standard Deviation (Population) | 5.2% | 6.2% |
Similar Demographics by Poverty
Demographics Similar to Immigrants from Guyana by Poverty
In terms of poverty, the demographic groups most similar to Immigrants from Guyana are Immigrants from Jamaica (14.4%, a difference of 0.13%), Guyanese (14.5%, a difference of 0.17%), Jamaican (14.4%, a difference of 0.21%), Iroquois (14.5%, a difference of 0.49%), and Subsaharan African (14.5%, a difference of 0.52%).
| Demographics | Rating | Rank | Poverty |
| Ottawa | 0.1 /100 | #258 | Tragic 14.3% |
| Immigrants | Nicaragua | 0.1 /100 | #259 | Tragic 14.3% |
| Cape Verdeans | 0.1 /100 | #260 | Tragic 14.4% |
| Cherokee | 0.1 /100 | #261 | Tragic 14.4% |
| Immigrants | Liberia | 0.1 /100 | #262 | Tragic 14.4% |
| Jamaicans | 0.1 /100 | #263 | Tragic 14.4% |
| Immigrants | Jamaica | 0.1 /100 | #264 | Tragic 14.4% |
| Immigrants | Guyana | 0.1 /100 | #265 | Tragic 14.5% |
| Guyanese | 0.1 /100 | #266 | Tragic 14.5% |
| Iroquois | 0.1 /100 | #267 | Tragic 14.5% |
| Sub-Saharan Africans | 0.1 /100 | #268 | Tragic 14.5% |
| Immigrants | Cuba | 0.1 /100 | #269 | Tragic 14.6% |
| Central Americans | 0.1 /100 | #270 | Tragic 14.6% |
| Shoshone | 0.0 /100 | #271 | Tragic 14.7% |
| Chickasaw | 0.0 /100 | #272 | Tragic 14.7% |
Demographics Similar to Germans by Poverty
In terms of poverty, the demographic groups most similar to Germans are Scandinavian (11.1%, a difference of 0.060%), Estonian (11.1%, a difference of 0.10%), Immigrants from Europe (11.2%, a difference of 0.15%), Immigrants from Sri Lanka (11.2%, a difference of 0.31%), and Immigrants from Italy (11.2%, a difference of 0.37%).
| Demographics | Rating | Rank | Poverty |
| Immigrants | Croatia | 98.7 /100 | #51 | Exceptional 11.0% |
| Immigrants | Philippines | 98.7 /100 | #52 | Exceptional 11.0% |
| Immigrants | Austria | 98.6 /100 | #53 | Exceptional 11.1% |
| Immigrants | Bulgaria | 98.5 /100 | #54 | Exceptional 11.1% |
| Immigrants | Serbia | 98.5 /100 | #55 | Exceptional 11.1% |
| Estonians | 98.2 /100 | #56 | Exceptional 11.1% |
| Scandinavians | 98.2 /100 | #57 | Exceptional 11.1% |
| Germans | 98.1 /100 | #58 | Exceptional 11.1% |
| Immigrants | Europe | 98.0 /100 | #59 | Exceptional 11.2% |
| Immigrants | Sri Lanka | 97.9 /100 | #60 | Exceptional 11.2% |
| Immigrants | Italy | 97.9 /100 | #61 | Exceptional 11.2% |
| Austrians | 97.8 /100 | #62 | Exceptional 11.2% |
| Ukrainians | 97.8 /100 | #63 | Exceptional 11.2% |
| Swiss | 97.7 /100 | #64 | Exceptional 11.2% |
| Immigrants | Asia | 97.5 /100 | #65 | Exceptional 11.2% |