Immigrants from Guyana vs Belizean Poverty
COMPARE
Immigrants from Guyana
Belizean
Poverty
Poverty Comparison
Immigrants from Guyana
Belizeans
14.5%
POVERTY
0.1/ 100
METRIC RATING
265th/ 347
METRIC RANK
14.8%
POVERTY
0.0/ 100
METRIC RATING
278th/ 347
METRIC RANK
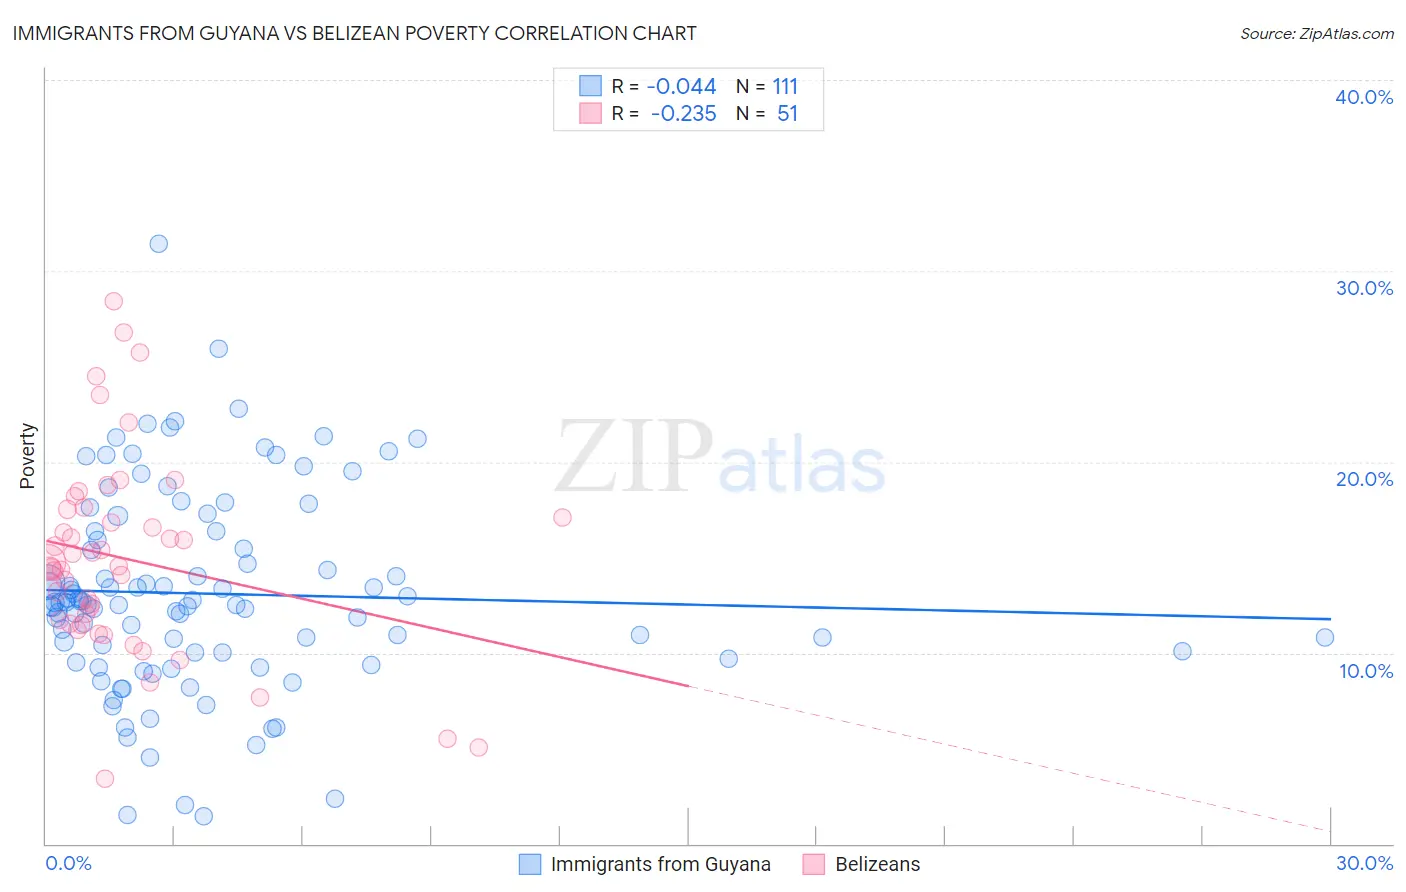
Immigrants from Guyana vs Belizean Poverty Correlation Chart
The statistical analysis conducted on geographies consisting of 183,648,527 people shows no correlation between the proportion of Immigrants from Guyana and poverty level in the United States with a correlation coefficient (R) of -0.044 and weighted average of 14.5%. Similarly, the statistical analysis conducted on geographies consisting of 144,164,069 people shows a weak negative correlation between the proportion of Belizeans and poverty level in the United States with a correlation coefficient (R) of -0.235 and weighted average of 14.8%, a difference of 2.5%.
Poverty Correlation Summary
| Measurement | Immigrants from Guyana | Belizean |
| Minimum | 1.4% | 3.4% |
| Maximum | 31.4% | 28.4% |
| Range | 30.0% | 25.0% |
| Mean | 13.1% | 14.9% |
| Median | 12.6% | 14.5% |
| Interquartile 25% (IQ1) | 10.0% | 11.5% |
| Interquartile 75% (IQ3) | 16.4% | 17.5% |
| Interquartile Range (IQR) | 6.4% | 6.0% |
| Standard Deviation (Sample) | 5.3% | 5.2% |
| Standard Deviation (Population) | 5.2% | 5.2% |
Demographics Similar to Immigrants from Guyana and Belizeans by Poverty
In terms of poverty, the demographic groups most similar to Immigrants from Guyana are Immigrants from Jamaica (14.4%, a difference of 0.13%), Guyanese (14.5%, a difference of 0.17%), Jamaican (14.4%, a difference of 0.21%), Iroquois (14.5%, a difference of 0.49%), and Subsaharan African (14.5%, a difference of 0.52%). Similarly, the demographic groups most similar to Belizeans are Bangladeshi (14.8%, a difference of 0.020%), Immigrants from Bahamas (14.8%, a difference of 0.070%), Immigrants from West Indies (14.8%, a difference of 0.080%), Barbadian (14.8%, a difference of 0.11%), and Immigrants from St. Vincent and the Grenadines (14.9%, a difference of 0.29%).
| Demographics | Rating | Rank | Poverty |
| Cherokee | 0.1 /100 | #261 | Tragic 14.4% |
| Immigrants | Liberia | 0.1 /100 | #262 | Tragic 14.4% |
| Jamaicans | 0.1 /100 | #263 | Tragic 14.4% |
| Immigrants | Jamaica | 0.1 /100 | #264 | Tragic 14.4% |
| Immigrants | Guyana | 0.1 /100 | #265 | Tragic 14.5% |
| Guyanese | 0.1 /100 | #266 | Tragic 14.5% |
| Iroquois | 0.1 /100 | #267 | Tragic 14.5% |
| Sub-Saharan Africans | 0.1 /100 | #268 | Tragic 14.5% |
| Immigrants | Cuba | 0.1 /100 | #269 | Tragic 14.6% |
| Central Americans | 0.1 /100 | #270 | Tragic 14.6% |
| Shoshone | 0.0 /100 | #271 | Tragic 14.7% |
| Chickasaw | 0.0 /100 | #272 | Tragic 14.7% |
| Spanish Americans | 0.0 /100 | #273 | Tragic 14.7% |
| Barbadians | 0.0 /100 | #274 | Tragic 14.8% |
| Immigrants | West Indies | 0.0 /100 | #275 | Tragic 14.8% |
| Immigrants | Bahamas | 0.0 /100 | #276 | Tragic 14.8% |
| Bangladeshis | 0.0 /100 | #277 | Tragic 14.8% |
| Belizeans | 0.0 /100 | #278 | Tragic 14.8% |
| Immigrants | St. Vincent and the Grenadines | 0.0 /100 | #279 | Tragic 14.9% |
| Haitians | 0.0 /100 | #280 | Tragic 14.9% |
| Immigrants | Barbados | 0.0 /100 | #281 | Tragic 14.9% |