Immigrants from Guyana vs Bulgarian Poverty
COMPARE
Immigrants from Guyana
Bulgarian
Poverty
Poverty Comparison
Immigrants from Guyana
Bulgarians
14.5%
POVERTY
0.1/ 100
METRIC RATING
265th/ 347
METRIC RANK
10.2%
POVERTY
99.9/ 100
METRIC RATING
10th/ 347
METRIC RANK
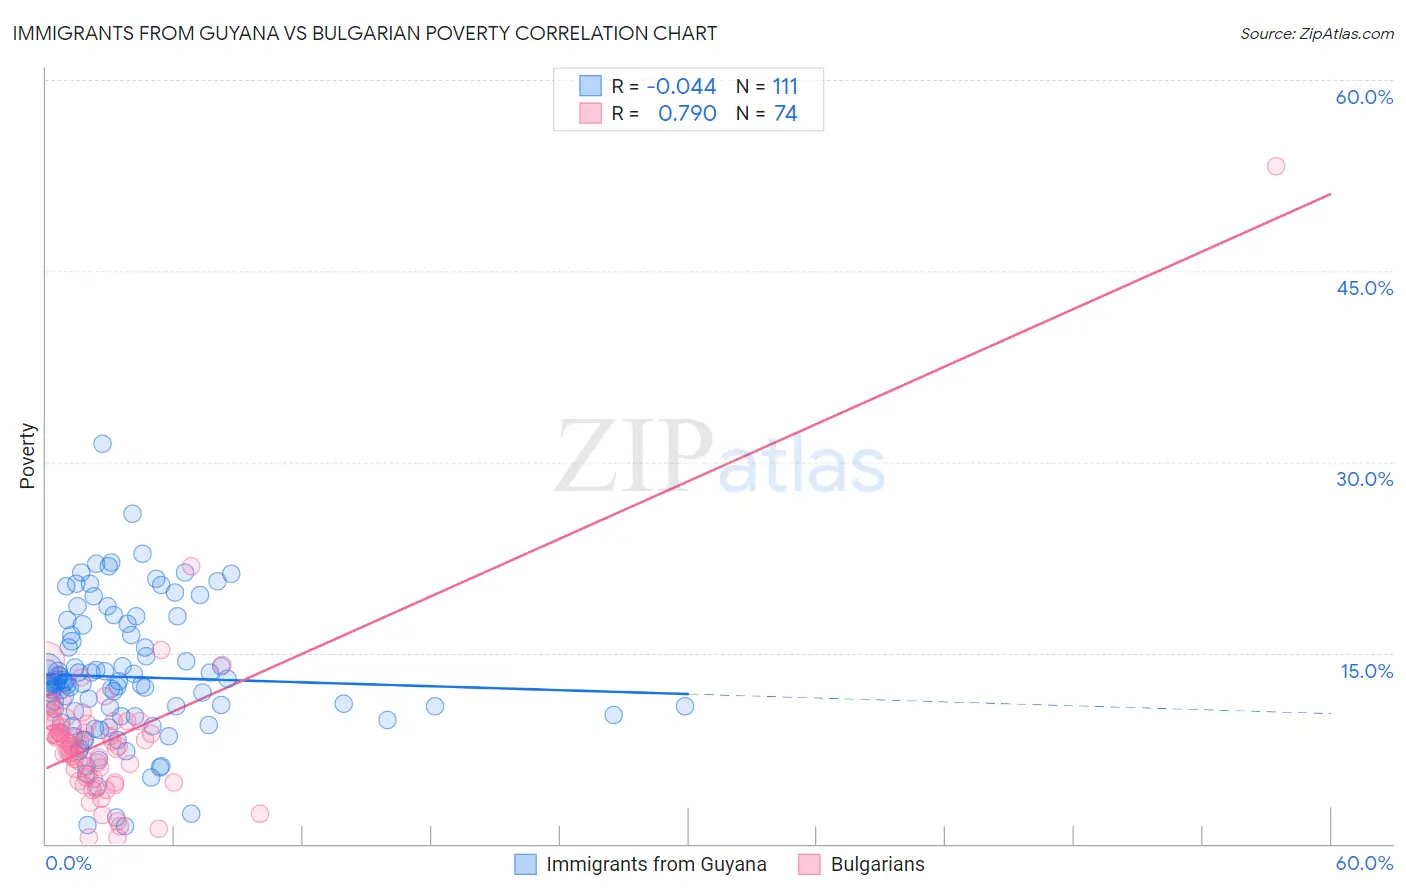
Immigrants from Guyana vs Bulgarian Poverty Correlation Chart
The statistical analysis conducted on geographies consisting of 183,648,527 people shows no correlation between the proportion of Immigrants from Guyana and poverty level in the United States with a correlation coefficient (R) of -0.044 and weighted average of 14.5%. Similarly, the statistical analysis conducted on geographies consisting of 205,564,290 people shows a strong positive correlation between the proportion of Bulgarians and poverty level in the United States with a correlation coefficient (R) of 0.790 and weighted average of 10.2%, a difference of 41.1%.
Poverty Correlation Summary
| Measurement | Immigrants from Guyana | Bulgarian |
| Minimum | 1.4% | 0.47% |
| Maximum | 31.4% | 53.2% |
| Range | 30.0% | 52.7% |
| Mean | 13.1% | 8.2% |
| Median | 12.6% | 7.8% |
| Interquartile 25% (IQ1) | 10.0% | 5.2% |
| Interquartile 75% (IQ3) | 16.4% | 9.5% |
| Interquartile Range (IQR) | 6.4% | 4.3% |
| Standard Deviation (Sample) | 5.3% | 6.4% |
| Standard Deviation (Population) | 5.2% | 6.3% |
Similar Demographics by Poverty
Demographics Similar to Immigrants from Guyana by Poverty
In terms of poverty, the demographic groups most similar to Immigrants from Guyana are Immigrants from Jamaica (14.4%, a difference of 0.13%), Guyanese (14.5%, a difference of 0.17%), Jamaican (14.4%, a difference of 0.21%), Iroquois (14.5%, a difference of 0.49%), and Subsaharan African (14.5%, a difference of 0.52%).
| Demographics | Rating | Rank | Poverty |
| Ottawa | 0.1 /100 | #258 | Tragic 14.3% |
| Immigrants | Nicaragua | 0.1 /100 | #259 | Tragic 14.3% |
| Cape Verdeans | 0.1 /100 | #260 | Tragic 14.4% |
| Cherokee | 0.1 /100 | #261 | Tragic 14.4% |
| Immigrants | Liberia | 0.1 /100 | #262 | Tragic 14.4% |
| Jamaicans | 0.1 /100 | #263 | Tragic 14.4% |
| Immigrants | Jamaica | 0.1 /100 | #264 | Tragic 14.4% |
| Immigrants | Guyana | 0.1 /100 | #265 | Tragic 14.5% |
| Guyanese | 0.1 /100 | #266 | Tragic 14.5% |
| Iroquois | 0.1 /100 | #267 | Tragic 14.5% |
| Sub-Saharan Africans | 0.1 /100 | #268 | Tragic 14.5% |
| Immigrants | Cuba | 0.1 /100 | #269 | Tragic 14.6% |
| Central Americans | 0.1 /100 | #270 | Tragic 14.6% |
| Shoshone | 0.0 /100 | #271 | Tragic 14.7% |
| Chickasaw | 0.0 /100 | #272 | Tragic 14.7% |
Demographics Similar to Bulgarians by Poverty
In terms of poverty, the demographic groups most similar to Bulgarians are Immigrants from South Central Asia (10.2%, a difference of 0.41%), Maltese (10.2%, a difference of 0.86%), Immigrants from Lithuania (10.3%, a difference of 0.99%), Filipino (10.1%, a difference of 1.3%), and Bhutanese (10.4%, a difference of 1.3%).
| Demographics | Rating | Rank | Poverty |
| Thais | 100.0 /100 | #3 | Exceptional 9.6% |
| Immigrants | Taiwan | 100.0 /100 | #4 | Exceptional 9.7% |
| Immigrants | Ireland | 99.9 /100 | #5 | Exceptional 10.1% |
| Assyrians/Chaldeans/Syriacs | 99.9 /100 | #6 | Exceptional 10.1% |
| Filipinos | 99.9 /100 | #7 | Exceptional 10.1% |
| Maltese | 99.9 /100 | #8 | Exceptional 10.2% |
| Immigrants | South Central Asia | 99.9 /100 | #9 | Exceptional 10.2% |
| Bulgarians | 99.9 /100 | #10 | Exceptional 10.2% |
| Immigrants | Lithuania | 99.9 /100 | #11 | Exceptional 10.3% |
| Bhutanese | 99.8 /100 | #12 | Exceptional 10.4% |
| Immigrants | Hong Kong | 99.8 /100 | #13 | Exceptional 10.4% |
| Immigrants | Bolivia | 99.8 /100 | #14 | Exceptional 10.4% |
| Bolivians | 99.8 /100 | #15 | Exceptional 10.4% |
| Lithuanians | 99.8 /100 | #16 | Exceptional 10.5% |
| Norwegians | 99.8 /100 | #17 | Exceptional 10.5% |