Immigrants from Guyana vs Norwegian Poverty
COMPARE
Immigrants from Guyana
Norwegian
Poverty
Poverty Comparison
Immigrants from Guyana
Norwegians
14.5%
POVERTY
0.1/ 100
METRIC RATING
265th/ 347
METRIC RANK
10.5%
POVERTY
99.8/ 100
METRIC RATING
17th/ 347
METRIC RANK
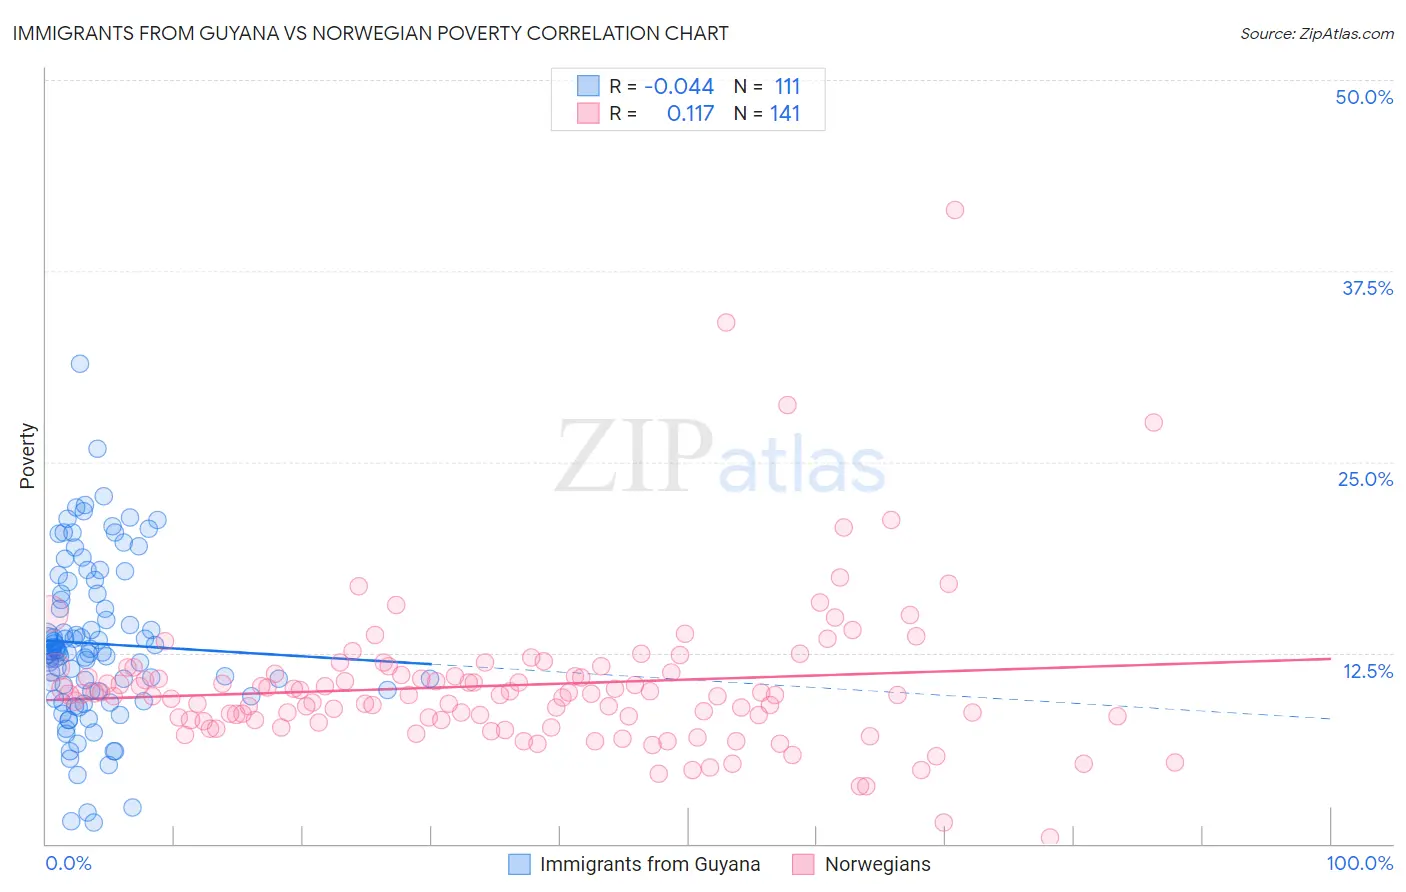
Immigrants from Guyana vs Norwegian Poverty Correlation Chart
The statistical analysis conducted on geographies consisting of 183,648,527 people shows no correlation between the proportion of Immigrants from Guyana and poverty level in the United States with a correlation coefficient (R) of -0.044 and weighted average of 14.5%. Similarly, the statistical analysis conducted on geographies consisting of 532,786,336 people shows a poor positive correlation between the proportion of Norwegians and poverty level in the United States with a correlation coefficient (R) of 0.117 and weighted average of 10.5%, a difference of 37.6%.
Poverty Correlation Summary
| Measurement | Immigrants from Guyana | Norwegian |
| Minimum | 1.4% | 0.40% |
| Maximum | 31.4% | 41.5% |
| Range | 30.0% | 41.1% |
| Mean | 13.1% | 10.4% |
| Median | 12.6% | 9.8% |
| Interquartile 25% (IQ1) | 10.0% | 8.1% |
| Interquartile 75% (IQ3) | 16.4% | 11.2% |
| Interquartile Range (IQR) | 6.4% | 3.0% |
| Standard Deviation (Sample) | 5.3% | 5.0% |
| Standard Deviation (Population) | 5.2% | 5.0% |
Similar Demographics by Poverty
Demographics Similar to Immigrants from Guyana by Poverty
In terms of poverty, the demographic groups most similar to Immigrants from Guyana are Immigrants from Jamaica (14.4%, a difference of 0.13%), Guyanese (14.5%, a difference of 0.17%), Jamaican (14.4%, a difference of 0.21%), Iroquois (14.5%, a difference of 0.49%), and Subsaharan African (14.5%, a difference of 0.52%).
| Demographics | Rating | Rank | Poverty |
| Ottawa | 0.1 /100 | #258 | Tragic 14.3% |
| Immigrants | Nicaragua | 0.1 /100 | #259 | Tragic 14.3% |
| Cape Verdeans | 0.1 /100 | #260 | Tragic 14.4% |
| Cherokee | 0.1 /100 | #261 | Tragic 14.4% |
| Immigrants | Liberia | 0.1 /100 | #262 | Tragic 14.4% |
| Jamaicans | 0.1 /100 | #263 | Tragic 14.4% |
| Immigrants | Jamaica | 0.1 /100 | #264 | Tragic 14.4% |
| Immigrants | Guyana | 0.1 /100 | #265 | Tragic 14.5% |
| Guyanese | 0.1 /100 | #266 | Tragic 14.5% |
| Iroquois | 0.1 /100 | #267 | Tragic 14.5% |
| Sub-Saharan Africans | 0.1 /100 | #268 | Tragic 14.5% |
| Immigrants | Cuba | 0.1 /100 | #269 | Tragic 14.6% |
| Central Americans | 0.1 /100 | #270 | Tragic 14.6% |
| Shoshone | 0.0 /100 | #271 | Tragic 14.7% |
| Chickasaw | 0.0 /100 | #272 | Tragic 14.7% |
Demographics Similar to Norwegians by Poverty
In terms of poverty, the demographic groups most similar to Norwegians are Latvian (10.5%, a difference of 0.10%), Lithuanian (10.5%, a difference of 0.37%), Immigrants from Scotland (10.6%, a difference of 0.49%), Immigrants from North Macedonia (10.6%, a difference of 0.60%), and Bolivian (10.4%, a difference of 0.67%).
| Demographics | Rating | Rank | Poverty |
| Bulgarians | 99.9 /100 | #10 | Exceptional 10.2% |
| Immigrants | Lithuania | 99.9 /100 | #11 | Exceptional 10.3% |
| Bhutanese | 99.8 /100 | #12 | Exceptional 10.4% |
| Immigrants | Hong Kong | 99.8 /100 | #13 | Exceptional 10.4% |
| Immigrants | Bolivia | 99.8 /100 | #14 | Exceptional 10.4% |
| Bolivians | 99.8 /100 | #15 | Exceptional 10.4% |
| Lithuanians | 99.8 /100 | #16 | Exceptional 10.5% |
| Norwegians | 99.8 /100 | #17 | Exceptional 10.5% |
| Latvians | 99.8 /100 | #18 | Exceptional 10.5% |
| Immigrants | Scotland | 99.7 /100 | #19 | Exceptional 10.6% |
| Immigrants | North Macedonia | 99.7 /100 | #20 | Exceptional 10.6% |
| Luxembourgers | 99.7 /100 | #21 | Exceptional 10.6% |
| Eastern Europeans | 99.7 /100 | #22 | Exceptional 10.6% |
| Swedes | 99.7 /100 | #23 | Exceptional 10.6% |
| Italians | 99.7 /100 | #24 | Exceptional 10.6% |