Immigrants from Guyana vs Hawaiian Poverty
COMPARE
Immigrants from Guyana
Hawaiian
Poverty
Poverty Comparison
Immigrants from Guyana
Hawaiians
14.5%
POVERTY
0.1/ 100
METRIC RATING
265th/ 347
METRIC RANK
12.5%
POVERTY
34.1/ 100
METRIC RATING
187th/ 347
METRIC RANK
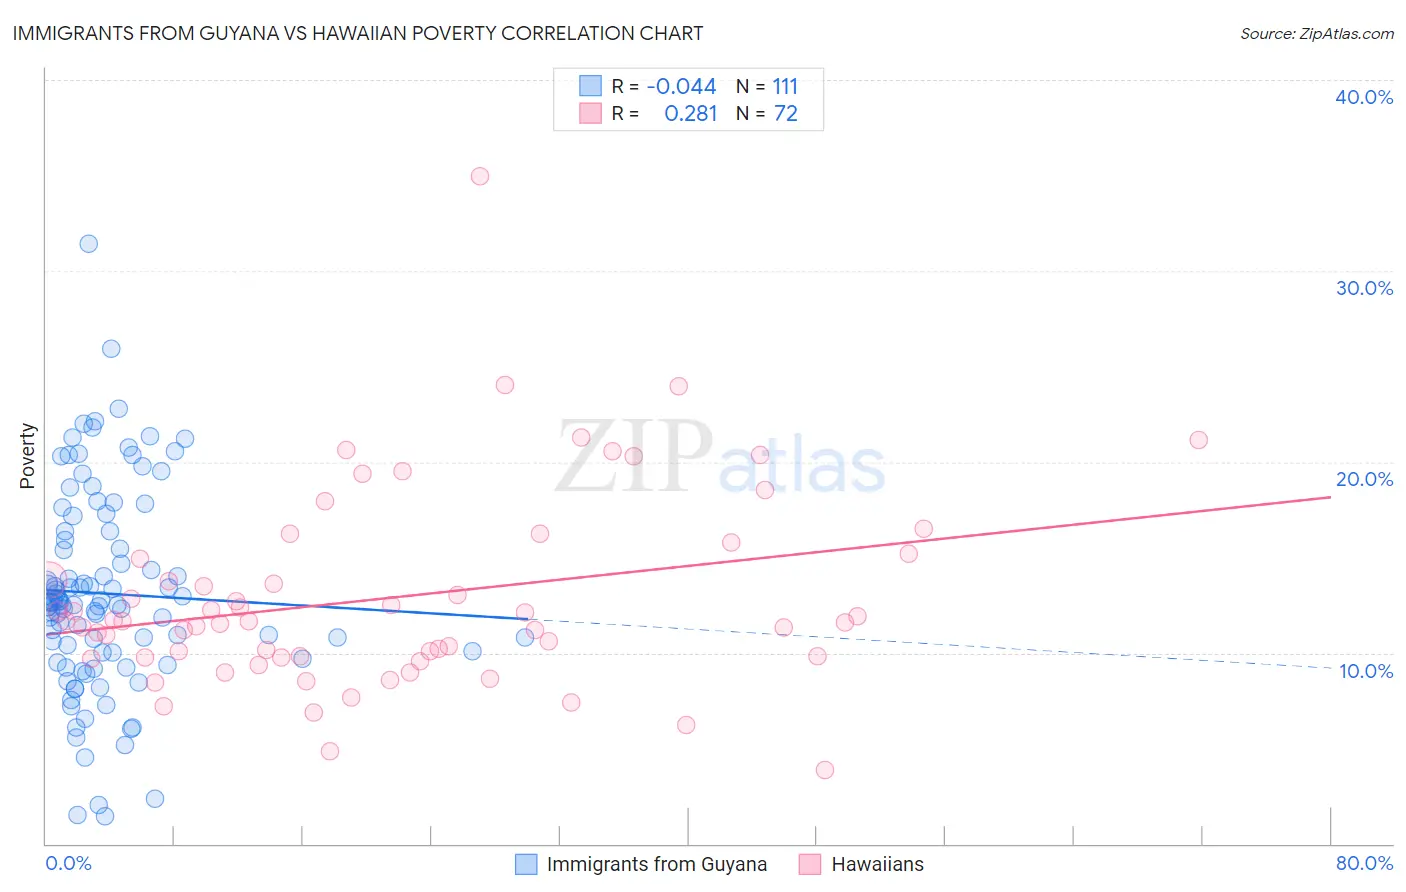
Immigrants from Guyana vs Hawaiian Poverty Correlation Chart
The statistical analysis conducted on geographies consisting of 183,648,527 people shows no correlation between the proportion of Immigrants from Guyana and poverty level in the United States with a correlation coefficient (R) of -0.044 and weighted average of 14.5%. Similarly, the statistical analysis conducted on geographies consisting of 327,385,556 people shows a weak positive correlation between the proportion of Hawaiians and poverty level in the United States with a correlation coefficient (R) of 0.281 and weighted average of 12.5%, a difference of 15.5%.
Poverty Correlation Summary
| Measurement | Immigrants from Guyana | Hawaiian |
| Minimum | 1.4% | 3.8% |
| Maximum | 31.4% | 35.0% |
| Range | 30.0% | 31.1% |
| Mean | 13.1% | 12.9% |
| Median | 12.6% | 11.6% |
| Interquartile 25% (IQ1) | 10.0% | 9.8% |
| Interquartile 75% (IQ3) | 16.4% | 15.1% |
| Interquartile Range (IQR) | 6.4% | 5.3% |
| Standard Deviation (Sample) | 5.3% | 5.1% |
| Standard Deviation (Population) | 5.2% | 5.1% |
Similar Demographics by Poverty
Demographics Similar to Immigrants from Guyana by Poverty
In terms of poverty, the demographic groups most similar to Immigrants from Guyana are Immigrants from Jamaica (14.4%, a difference of 0.13%), Guyanese (14.5%, a difference of 0.17%), Jamaican (14.4%, a difference of 0.21%), Iroquois (14.5%, a difference of 0.49%), and Subsaharan African (14.5%, a difference of 0.52%).
| Demographics | Rating | Rank | Poverty |
| Ottawa | 0.1 /100 | #258 | Tragic 14.3% |
| Immigrants | Nicaragua | 0.1 /100 | #259 | Tragic 14.3% |
| Cape Verdeans | 0.1 /100 | #260 | Tragic 14.4% |
| Cherokee | 0.1 /100 | #261 | Tragic 14.4% |
| Immigrants | Liberia | 0.1 /100 | #262 | Tragic 14.4% |
| Jamaicans | 0.1 /100 | #263 | Tragic 14.4% |
| Immigrants | Jamaica | 0.1 /100 | #264 | Tragic 14.4% |
| Immigrants | Guyana | 0.1 /100 | #265 | Tragic 14.5% |
| Guyanese | 0.1 /100 | #266 | Tragic 14.5% |
| Iroquois | 0.1 /100 | #267 | Tragic 14.5% |
| Sub-Saharan Africans | 0.1 /100 | #268 | Tragic 14.5% |
| Immigrants | Cuba | 0.1 /100 | #269 | Tragic 14.6% |
| Central Americans | 0.1 /100 | #270 | Tragic 14.6% |
| Shoshone | 0.0 /100 | #271 | Tragic 14.7% |
| Chickasaw | 0.0 /100 | #272 | Tragic 14.7% |
Demographics Similar to Hawaiians by Poverty
In terms of poverty, the demographic groups most similar to Hawaiians are Immigrants from Costa Rica (12.5%, a difference of 0.090%), Aleut (12.5%, a difference of 0.090%), Immigrants from South America (12.5%, a difference of 0.19%), Immigrants from Sierra Leone (12.5%, a difference of 0.23%), and Israeli (12.5%, a difference of 0.25%).
| Demographics | Rating | Rank | Poverty |
| Mongolians | 43.6 /100 | #180 | Average 12.4% |
| Immigrants | Afghanistan | 42.1 /100 | #181 | Average 12.4% |
| Immigrants | Cameroon | 41.7 /100 | #182 | Average 12.4% |
| Immigrants | Iraq | 40.2 /100 | #183 | Average 12.4% |
| Kenyans | 38.8 /100 | #184 | Fair 12.5% |
| Israelis | 36.4 /100 | #185 | Fair 12.5% |
| Immigrants | Sierra Leone | 36.3 /100 | #186 | Fair 12.5% |
| Hawaiians | 34.1 /100 | #187 | Fair 12.5% |
| Immigrants | Costa Rica | 33.3 /100 | #188 | Fair 12.5% |
| Aleuts | 33.2 /100 | #189 | Fair 12.5% |
| Immigrants | South America | 32.3 /100 | #190 | Fair 12.5% |
| Sierra Leoneans | 31.5 /100 | #191 | Fair 12.6% |
| South American Indians | 23.3 /100 | #192 | Fair 12.7% |
| Delaware | 21.4 /100 | #193 | Fair 12.7% |
| Arabs | 21.1 /100 | #194 | Fair 12.7% |