Immigrants from Guyana vs Immigrants from Belarus Kindergarten
COMPARE
Immigrants from Guyana
Immigrants from Belarus
Kindergarten
Kindergarten Comparison
Immigrants from Guyana
Immigrants from Belarus
96.8%
KINDERGARTEN
0.0/ 100
METRIC RATING
319th/ 347
METRIC RANK
97.9%
KINDERGARTEN
39.4/ 100
METRIC RATING
185th/ 347
METRIC RANK
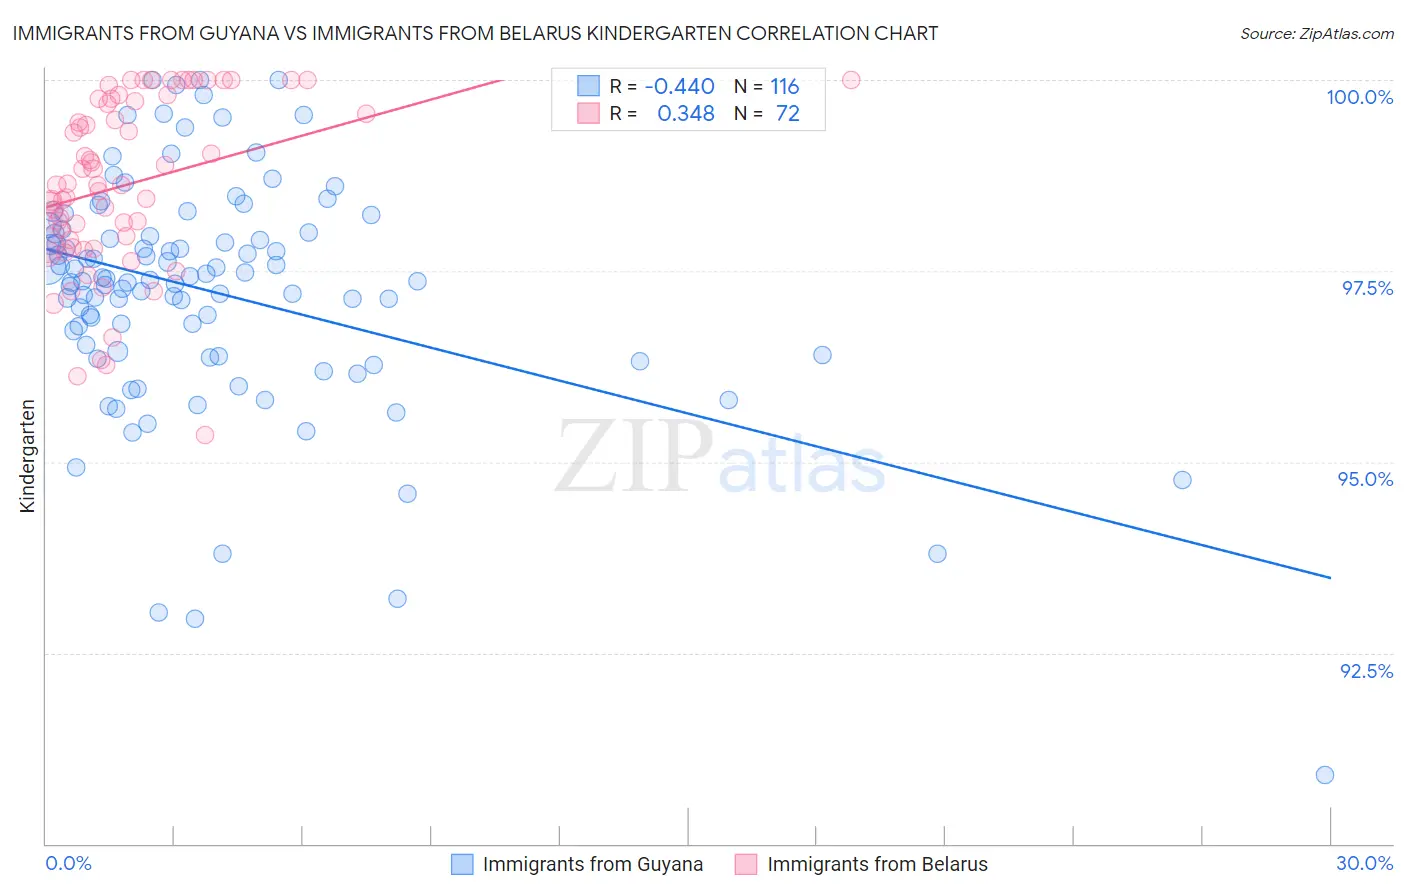
Immigrants from Guyana vs Immigrants from Belarus Kindergarten Correlation Chart
The statistical analysis conducted on geographies consisting of 183,746,342 people shows a moderate negative correlation between the proportion of Immigrants from Guyana and percentage of population with at least kindergarten education in the United States with a correlation coefficient (R) of -0.440 and weighted average of 96.8%. Similarly, the statistical analysis conducted on geographies consisting of 149,993,317 people shows a mild positive correlation between the proportion of Immigrants from Belarus and percentage of population with at least kindergarten education in the United States with a correlation coefficient (R) of 0.348 and weighted average of 97.9%, a difference of 1.1%.
Kindergarten Correlation Summary
| Measurement | Immigrants from Guyana | Immigrants from Belarus |
| Minimum | 90.9% | 95.4% |
| Maximum | 100.0% | 100.0% |
| Range | 9.1% | 4.6% |
| Mean | 97.2% | 98.6% |
| Median | 97.4% | 98.6% |
| Interquartile 25% (IQ1) | 96.4% | 97.9% |
| Interquartile 75% (IQ3) | 98.0% | 99.7% |
| Interquartile Range (IQR) | 1.6% | 1.9% |
| Standard Deviation (Sample) | 1.5% | 1.1% |
| Standard Deviation (Population) | 1.5% | 1.1% |
Similar Demographics by Kindergarten
Demographics Similar to Immigrants from Guyana by Kindergarten
In terms of kindergarten, the demographic groups most similar to Immigrants from Guyana are Immigrants from Burma/Myanmar (96.8%, a difference of 0.0%), Immigrants from Laos (96.9%, a difference of 0.010%), Immigrants from Bangladesh (96.8%, a difference of 0.010%), Mexican American Indian (96.8%, a difference of 0.020%), and Immigrants from Honduras (96.8%, a difference of 0.030%).
| Demographics | Rating | Rank | Kindergarten |
| Guyanese | 0.0 /100 | #312 | Tragic 96.9% |
| Cape Verdeans | 0.0 /100 | #313 | Tragic 96.9% |
| Hondurans | 0.0 /100 | #314 | Tragic 96.9% |
| Immigrants | Belize | 0.0 /100 | #315 | Tragic 96.9% |
| Immigrants | Nicaragua | 0.0 /100 | #316 | Tragic 96.9% |
| Immigrants | Ecuador | 0.0 /100 | #317 | Tragic 96.9% |
| Immigrants | Laos | 0.0 /100 | #318 | Tragic 96.9% |
| Immigrants | Guyana | 0.0 /100 | #319 | Tragic 96.8% |
| Immigrants | Burma/Myanmar | 0.0 /100 | #320 | Tragic 96.8% |
| Immigrants | Bangladesh | 0.0 /100 | #321 | Tragic 96.8% |
| Mexican American Indians | 0.0 /100 | #322 | Tragic 96.8% |
| Immigrants | Honduras | 0.0 /100 | #323 | Tragic 96.8% |
| Vietnamese | 0.0 /100 | #324 | Tragic 96.8% |
| Indonesians | 0.0 /100 | #325 | Tragic 96.8% |
| Dominicans | 0.0 /100 | #326 | Tragic 96.8% |
Demographics Similar to Immigrants from Belarus by Kindergarten
In terms of kindergarten, the demographic groups most similar to Immigrants from Belarus are Immigrants from Argentina (97.9%, a difference of 0.0%), Portuguese (97.9%, a difference of 0.010%), Egyptian (97.9%, a difference of 0.010%), Immigrants from Poland (97.9%, a difference of 0.010%), and Pakistani (97.9%, a difference of 0.010%).
| Demographics | Rating | Rank | Kindergarten |
| Brazilians | 47.6 /100 | #178 | Average 97.9% |
| Argentineans | 46.8 /100 | #179 | Average 97.9% |
| Immigrants | Bosnia and Herzegovina | 46.7 /100 | #180 | Average 97.9% |
| Portuguese | 43.5 /100 | #181 | Average 97.9% |
| Egyptians | 42.4 /100 | #182 | Average 97.9% |
| Immigrants | Poland | 41.4 /100 | #183 | Average 97.9% |
| Immigrants | Argentina | 40.7 /100 | #184 | Average 97.9% |
| Immigrants | Belarus | 39.4 /100 | #185 | Fair 97.9% |
| Pakistanis | 36.0 /100 | #186 | Fair 97.9% |
| Immigrants | Kazakhstan | 35.9 /100 | #187 | Fair 97.9% |
| Arabs | 35.4 /100 | #188 | Fair 97.9% |
| Paiute | 34.7 /100 | #189 | Fair 97.9% |
| Panamanians | 33.3 /100 | #190 | Fair 97.9% |
| Immigrants | Taiwan | 30.7 /100 | #191 | Fair 97.9% |
| Blacks/African Americans | 29.9 /100 | #192 | Fair 97.9% |