Malaysian vs Hawaiian Poverty
COMPARE
Malaysian
Hawaiian
Poverty
Poverty Comparison
Malaysians
Hawaiians
13.1%
POVERTY
6.1/ 100
METRIC RATING
209th/ 347
METRIC RANK
12.5%
POVERTY
34.1/ 100
METRIC RATING
187th/ 347
METRIC RANK
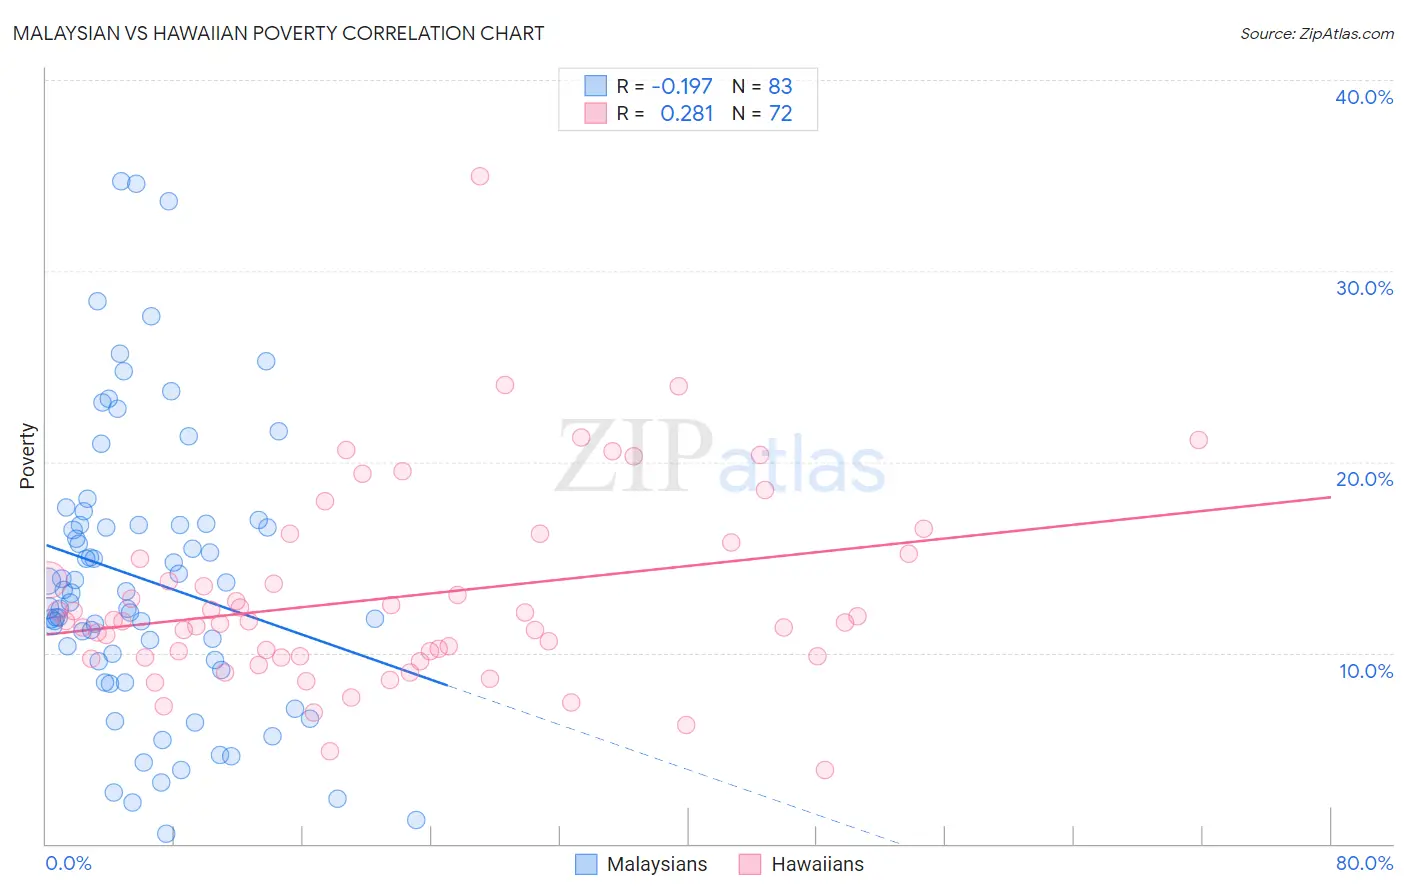
Malaysian vs Hawaiian Poverty Correlation Chart
The statistical analysis conducted on geographies consisting of 226,011,043 people shows a poor negative correlation between the proportion of Malaysians and poverty level in the United States with a correlation coefficient (R) of -0.197 and weighted average of 13.1%. Similarly, the statistical analysis conducted on geographies consisting of 327,385,556 people shows a weak positive correlation between the proportion of Hawaiians and poverty level in the United States with a correlation coefficient (R) of 0.281 and weighted average of 12.5%, a difference of 4.9%.
Poverty Correlation Summary
| Measurement | Malaysian | Hawaiian |
| Minimum | 0.56% | 3.8% |
| Maximum | 34.7% | 35.0% |
| Range | 34.2% | 31.1% |
| Mean | 13.8% | 12.9% |
| Median | 13.1% | 11.6% |
| Interquartile 25% (IQ1) | 9.6% | 9.8% |
| Interquartile 75% (IQ3) | 16.7% | 15.1% |
| Interquartile Range (IQR) | 7.1% | 5.3% |
| Standard Deviation (Sample) | 7.4% | 5.1% |
| Standard Deviation (Population) | 7.4% | 5.1% |
Similar Demographics by Poverty
Demographics Similar to Malaysians by Poverty
In terms of poverty, the demographic groups most similar to Malaysians are Ugandan (13.1%, a difference of 0.030%), Immigrants from the Azores (13.1%, a difference of 0.030%), Panamanian (13.1%, a difference of 0.18%), Immigrants from Eastern Africa (13.1%, a difference of 0.30%), and Moroccan (13.2%, a difference of 0.38%).
| Demographics | Rating | Rank | Poverty |
| Immigrants | Uruguay | 15.6 /100 | #202 | Poor 12.8% |
| Hmong | 15.0 /100 | #203 | Poor 12.8% |
| Immigrants | Western Asia | 14.1 /100 | #204 | Poor 12.9% |
| Tsimshian | 9.2 /100 | #205 | Tragic 13.0% |
| Immigrants | Eastern Africa | 7.0 /100 | #206 | Tragic 13.1% |
| Panamanians | 6.6 /100 | #207 | Tragic 13.1% |
| Ugandans | 6.2 /100 | #208 | Tragic 13.1% |
| Malaysians | 6.1 /100 | #209 | Tragic 13.1% |
| Immigrants | Azores | 6.1 /100 | #210 | Tragic 13.1% |
| Moroccans | 5.2 /100 | #211 | Tragic 13.2% |
| Immigrants | Immigrants | 4.3 /100 | #212 | Tragic 13.2% |
| Immigrants | Panama | 4.1 /100 | #213 | Tragic 13.3% |
| Bermudans | 3.7 /100 | #214 | Tragic 13.3% |
| Japanese | 3.3 /100 | #215 | Tragic 13.3% |
| Immigrants | Nonimmigrants | 3.3 /100 | #216 | Tragic 13.3% |
Demographics Similar to Hawaiians by Poverty
In terms of poverty, the demographic groups most similar to Hawaiians are Immigrants from Costa Rica (12.5%, a difference of 0.090%), Aleut (12.5%, a difference of 0.090%), Immigrants from South America (12.5%, a difference of 0.19%), Immigrants from Sierra Leone (12.5%, a difference of 0.23%), and Israeli (12.5%, a difference of 0.25%).
| Demographics | Rating | Rank | Poverty |
| Mongolians | 43.6 /100 | #180 | Average 12.4% |
| Immigrants | Afghanistan | 42.1 /100 | #181 | Average 12.4% |
| Immigrants | Cameroon | 41.7 /100 | #182 | Average 12.4% |
| Immigrants | Iraq | 40.2 /100 | #183 | Average 12.4% |
| Kenyans | 38.8 /100 | #184 | Fair 12.5% |
| Israelis | 36.4 /100 | #185 | Fair 12.5% |
| Immigrants | Sierra Leone | 36.3 /100 | #186 | Fair 12.5% |
| Hawaiians | 34.1 /100 | #187 | Fair 12.5% |
| Immigrants | Costa Rica | 33.3 /100 | #188 | Fair 12.5% |
| Aleuts | 33.2 /100 | #189 | Fair 12.5% |
| Immigrants | South America | 32.3 /100 | #190 | Fair 12.5% |
| Sierra Leoneans | 31.5 /100 | #191 | Fair 12.6% |
| South American Indians | 23.3 /100 | #192 | Fair 12.7% |
| Delaware | 21.4 /100 | #193 | Fair 12.7% |
| Arabs | 21.1 /100 | #194 | Fair 12.7% |