Immigrants from Guyana vs Hawaiian Male Poverty
COMPARE
Immigrants from Guyana
Hawaiian
Male Poverty
Male Poverty Comparison
Immigrants from Guyana
Hawaiians
13.2%
MALE POVERTY
0.1/ 100
METRIC RATING
266th/ 347
METRIC RANK
11.4%
MALE POVERTY
28.3/ 100
METRIC RATING
189th/ 347
METRIC RANK
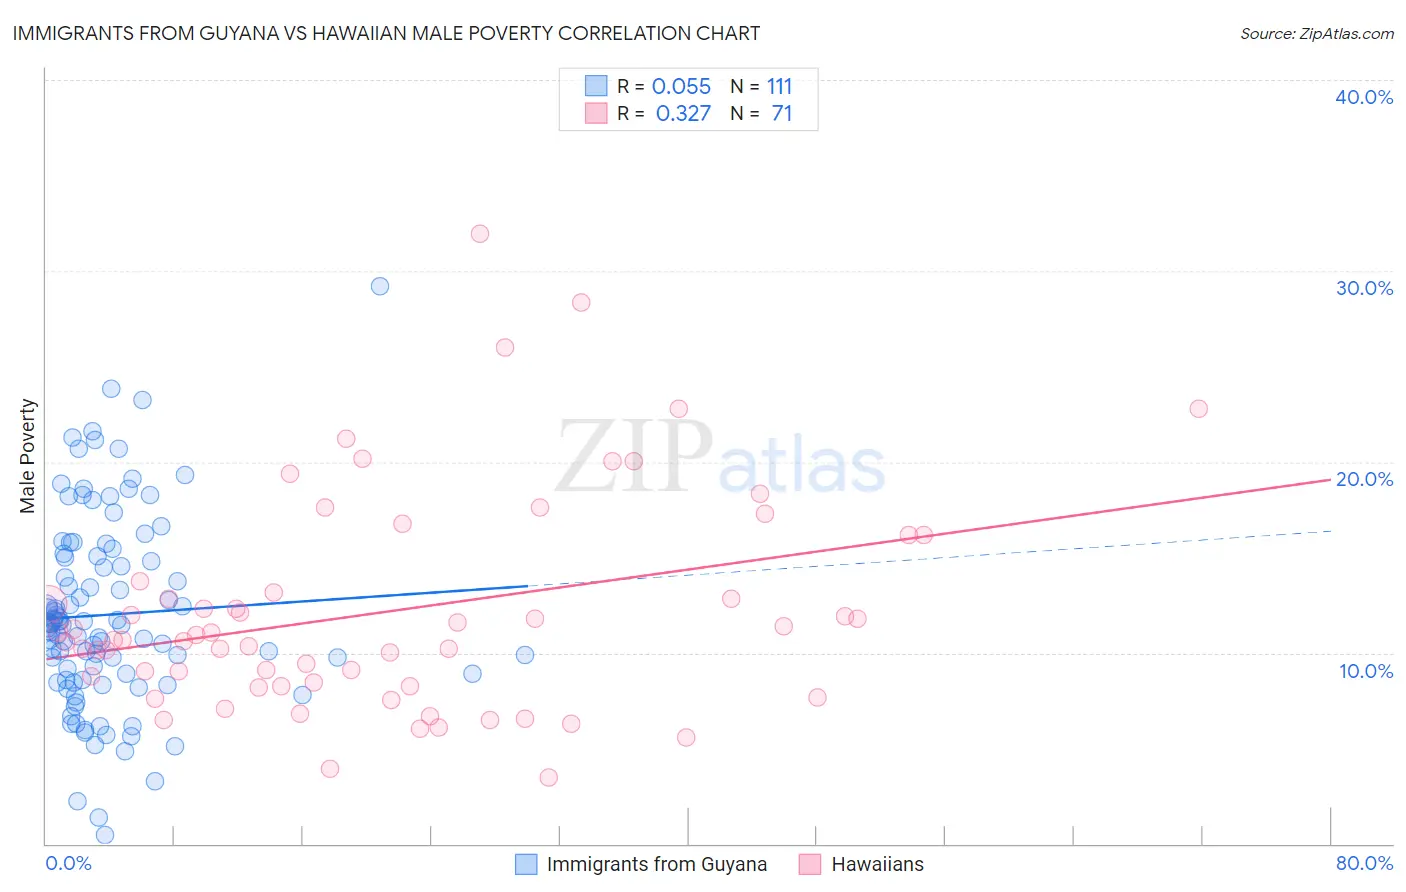
Immigrants from Guyana vs Hawaiian Male Poverty Correlation Chart
The statistical analysis conducted on geographies consisting of 183,559,274 people shows a slight positive correlation between the proportion of Immigrants from Guyana and poverty level among males in the United States with a correlation coefficient (R) of 0.055 and weighted average of 13.2%. Similarly, the statistical analysis conducted on geographies consisting of 327,329,663 people shows a mild positive correlation between the proportion of Hawaiians and poverty level among males in the United States with a correlation coefficient (R) of 0.327 and weighted average of 11.4%, a difference of 15.7%.
Male Poverty Correlation Summary
| Measurement | Immigrants from Guyana | Hawaiian |
| Minimum | 0.44% | 3.5% |
| Maximum | 29.2% | 31.9% |
| Range | 28.8% | 28.5% |
| Mean | 12.0% | 12.2% |
| Median | 11.4% | 10.7% |
| Interquartile 25% (IQ1) | 8.6% | 8.3% |
| Interquartile 75% (IQ3) | 15.1% | 13.7% |
| Interquartile Range (IQR) | 6.5% | 5.4% |
| Standard Deviation (Sample) | 5.0% | 5.7% |
| Standard Deviation (Population) | 5.0% | 5.7% |
Similar Demographics by Male Poverty
Demographics Similar to Immigrants from Guyana by Male Poverty
In terms of male poverty, the demographic groups most similar to Immigrants from Guyana are Immigrants from Jamaica (13.3%, a difference of 0.11%), Jamaican (13.2%, a difference of 0.14%), Subsaharan African (13.3%, a difference of 0.14%), Iroquois (13.2%, a difference of 0.16%), and Guyanese (13.3%, a difference of 0.36%).
| Demographics | Rating | Rank | Male Poverty |
| Cherokee | 0.1 /100 | #259 | Tragic 13.1% |
| Ottawa | 0.1 /100 | #260 | Tragic 13.1% |
| Trinidadians and Tobagonians | 0.1 /100 | #261 | Tragic 13.1% |
| Spanish American Indians | 0.1 /100 | #262 | Tragic 13.1% |
| Central Americans | 0.1 /100 | #263 | Tragic 13.2% |
| Iroquois | 0.1 /100 | #264 | Tragic 13.2% |
| Jamaicans | 0.1 /100 | #265 | Tragic 13.2% |
| Immigrants | Guyana | 0.1 /100 | #266 | Tragic 13.2% |
| Immigrants | Jamaica | 0.1 /100 | #267 | Tragic 13.3% |
| Sub-Saharan Africans | 0.1 /100 | #268 | Tragic 13.3% |
| Guyanese | 0.0 /100 | #269 | Tragic 13.3% |
| Cree | 0.0 /100 | #270 | Tragic 13.3% |
| Spanish Americans | 0.0 /100 | #271 | Tragic 13.4% |
| Immigrants | Bahamas | 0.0 /100 | #272 | Tragic 13.5% |
| Chickasaw | 0.0 /100 | #273 | Tragic 13.5% |
Demographics Similar to Hawaiians by Male Poverty
In terms of male poverty, the demographic groups most similar to Hawaiians are Sierra Leonean (11.4%, a difference of 0.18%), Israeli (11.5%, a difference of 0.26%), Immigrants from Iraq (11.4%, a difference of 0.41%), Immigrants from Sierra Leone (11.4%, a difference of 0.52%), and Immigrants from Afghanistan (11.4%, a difference of 0.57%).
| Demographics | Rating | Rank | Male Poverty |
| Mongolians | 39.0 /100 | #182 | Fair 11.3% |
| Kenyans | 38.4 /100 | #183 | Fair 11.3% |
| Immigrants | South America | 36.9 /100 | #184 | Fair 11.3% |
| Immigrants | Afghanistan | 33.3 /100 | #185 | Fair 11.4% |
| Immigrants | Sierra Leone | 32.9 /100 | #186 | Fair 11.4% |
| Immigrants | Iraq | 31.9 /100 | #187 | Fair 11.4% |
| Sierra Leoneans | 29.9 /100 | #188 | Fair 11.4% |
| Hawaiians | 28.3 /100 | #189 | Fair 11.4% |
| Israelis | 26.1 /100 | #190 | Fair 11.5% |
| South American Indians | 22.8 /100 | #191 | Fair 11.5% |
| Immigrants | Uruguay | 19.1 /100 | #192 | Poor 11.6% |
| Immigrants | Kuwait | 17.3 /100 | #193 | Poor 11.6% |
| Immigrants | Kenya | 16.1 /100 | #194 | Poor 11.6% |
| Arabs | 15.8 /100 | #195 | Poor 11.6% |
| Hmong | 15.8 /100 | #196 | Poor 11.6% |