Immigrants from Central America vs Hawaiian Poverty
COMPARE
Immigrants from Central America
Hawaiian
Poverty
Poverty Comparison
Immigrants from Central America
Hawaiians
15.4%
POVERTY
0.0/ 100
METRIC RATING
300th/ 347
METRIC RANK
12.5%
POVERTY
34.1/ 100
METRIC RATING
187th/ 347
METRIC RANK
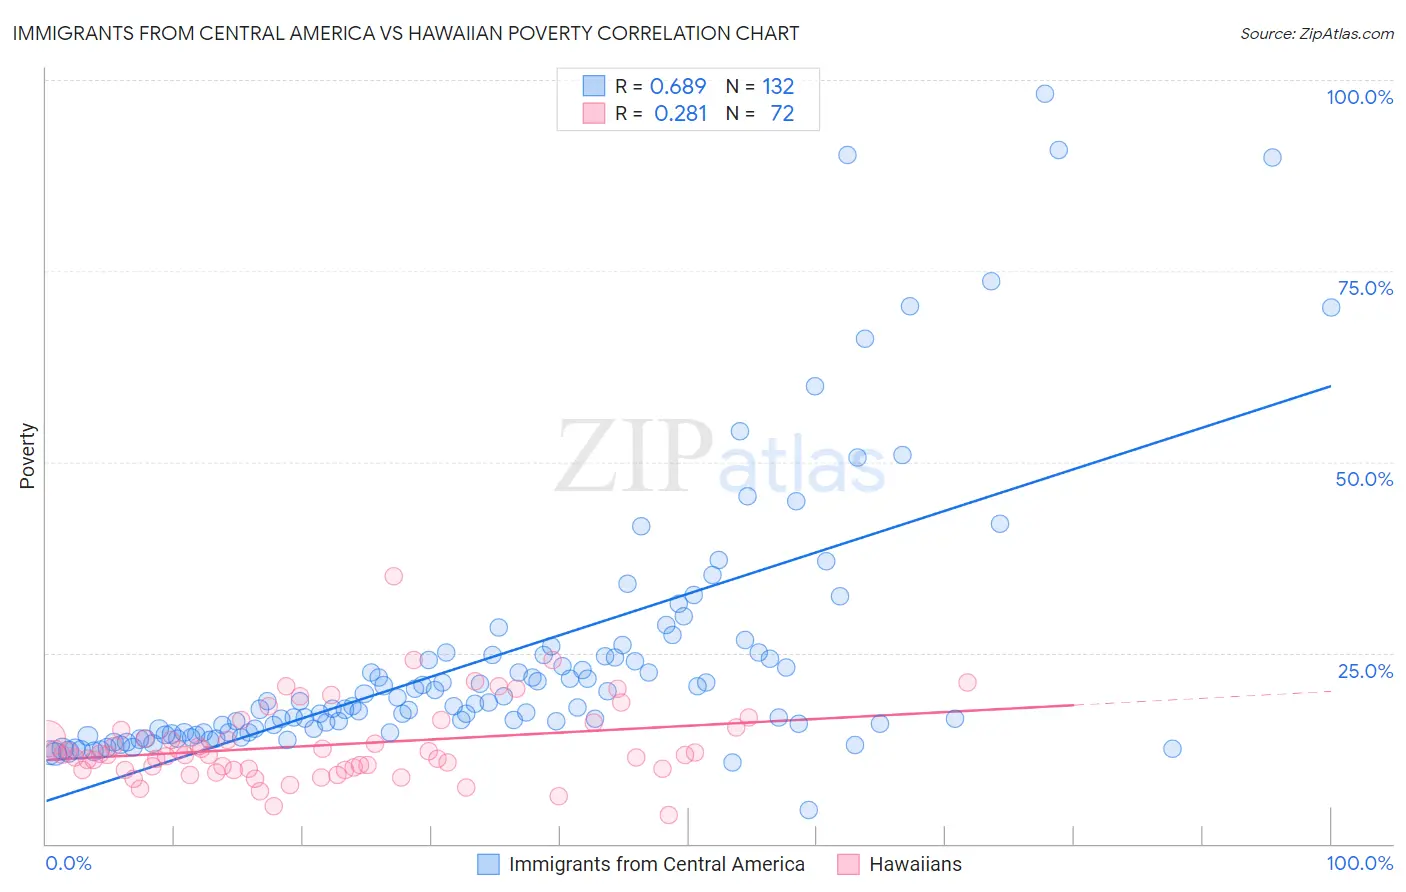
Immigrants from Central America vs Hawaiian Poverty Correlation Chart
The statistical analysis conducted on geographies consisting of 536,001,956 people shows a significant positive correlation between the proportion of Immigrants from Central America and poverty level in the United States with a correlation coefficient (R) of 0.689 and weighted average of 15.4%. Similarly, the statistical analysis conducted on geographies consisting of 327,385,556 people shows a weak positive correlation between the proportion of Hawaiians and poverty level in the United States with a correlation coefficient (R) of 0.281 and weighted average of 12.5%, a difference of 22.7%.
Poverty Correlation Summary
| Measurement | Immigrants from Central America | Hawaiian |
| Minimum | 4.4% | 3.8% |
| Maximum | 98.2% | 35.0% |
| Range | 93.8% | 31.1% |
| Mean | 24.4% | 12.9% |
| Median | 18.2% | 11.6% |
| Interquartile 25% (IQ1) | 14.5% | 9.8% |
| Interquartile 75% (IQ3) | 24.7% | 15.1% |
| Interquartile Range (IQR) | 10.2% | 5.3% |
| Standard Deviation (Sample) | 17.4% | 5.1% |
| Standard Deviation (Population) | 17.3% | 5.1% |
Similar Demographics by Poverty
Demographics Similar to Immigrants from Central America by Poverty
In terms of poverty, the demographic groups most similar to Immigrants from Central America are Bahamian (15.4%, a difference of 0.21%), Somali (15.4%, a difference of 0.34%), Senegalese (15.3%, a difference of 0.38%), Immigrants from Senegal (15.3%, a difference of 0.47%), and Immigrants from Bangladesh (15.3%, a difference of 0.62%).
| Demographics | Rating | Rank | Poverty |
| Immigrants | Zaire | 0.0 /100 | #293 | Tragic 15.1% |
| Blackfeet | 0.0 /100 | #294 | Tragic 15.2% |
| Guatemalans | 0.0 /100 | #295 | Tragic 15.3% |
| Hispanics or Latinos | 0.0 /100 | #296 | Tragic 15.3% |
| Immigrants | Bangladesh | 0.0 /100 | #297 | Tragic 15.3% |
| Immigrants | Senegal | 0.0 /100 | #298 | Tragic 15.3% |
| Senegalese | 0.0 /100 | #299 | Tragic 15.3% |
| Immigrants | Central America | 0.0 /100 | #300 | Tragic 15.4% |
| Bahamians | 0.0 /100 | #301 | Tragic 15.4% |
| Somalis | 0.0 /100 | #302 | Tragic 15.4% |
| Immigrants | Caribbean | 0.0 /100 | #303 | Tragic 15.5% |
| Immigrants | Mexico | 0.0 /100 | #304 | Tragic 15.5% |
| Immigrants | Guatemala | 0.0 /100 | #305 | Tragic 15.5% |
| Creek | 0.0 /100 | #306 | Tragic 15.6% |
| Africans | 0.0 /100 | #307 | Tragic 15.6% |
Demographics Similar to Hawaiians by Poverty
In terms of poverty, the demographic groups most similar to Hawaiians are Immigrants from Costa Rica (12.5%, a difference of 0.090%), Aleut (12.5%, a difference of 0.090%), Immigrants from South America (12.5%, a difference of 0.19%), Immigrants from Sierra Leone (12.5%, a difference of 0.23%), and Israeli (12.5%, a difference of 0.25%).
| Demographics | Rating | Rank | Poverty |
| Mongolians | 43.6 /100 | #180 | Average 12.4% |
| Immigrants | Afghanistan | 42.1 /100 | #181 | Average 12.4% |
| Immigrants | Cameroon | 41.7 /100 | #182 | Average 12.4% |
| Immigrants | Iraq | 40.2 /100 | #183 | Average 12.4% |
| Kenyans | 38.8 /100 | #184 | Fair 12.5% |
| Israelis | 36.4 /100 | #185 | Fair 12.5% |
| Immigrants | Sierra Leone | 36.3 /100 | #186 | Fair 12.5% |
| Hawaiians | 34.1 /100 | #187 | Fair 12.5% |
| Immigrants | Costa Rica | 33.3 /100 | #188 | Fair 12.5% |
| Aleuts | 33.2 /100 | #189 | Fair 12.5% |
| Immigrants | South America | 32.3 /100 | #190 | Fair 12.5% |
| Sierra Leoneans | 31.5 /100 | #191 | Fair 12.6% |
| South American Indians | 23.3 /100 | #192 | Fair 12.7% |
| Delaware | 21.4 /100 | #193 | Fair 12.7% |
| Arabs | 21.1 /100 | #194 | Fair 12.7% |