Tsimshian vs German Poverty
COMPARE
Tsimshian
German
Poverty
Poverty Comparison
Tsimshian
Germans
13.0%
POVERTY
9.2/ 100
METRIC RATING
205th/ 347
METRIC RANK
11.1%
POVERTY
98.1/ 100
METRIC RATING
58th/ 347
METRIC RANK
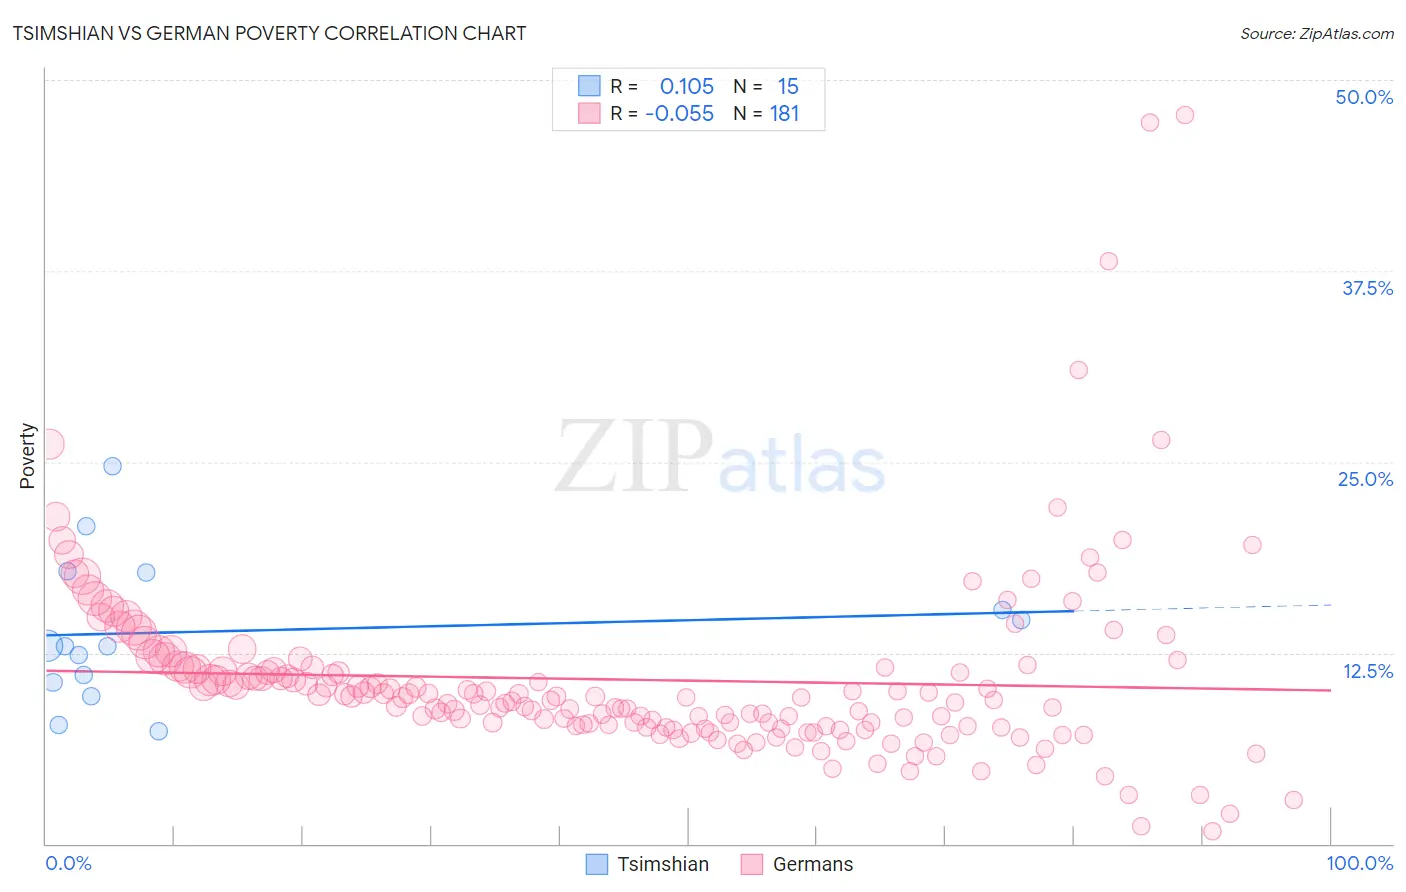
Tsimshian vs German Poverty Correlation Chart
The statistical analysis conducted on geographies consisting of 15,626,462 people shows a poor positive correlation between the proportion of Tsimshian and poverty level in the United States with a correlation coefficient (R) of 0.105 and weighted average of 13.0%. Similarly, the statistical analysis conducted on geographies consisting of 580,012,247 people shows a slight negative correlation between the proportion of Germans and poverty level in the United States with a correlation coefficient (R) of -0.055 and weighted average of 11.1%, a difference of 16.8%.
Poverty Correlation Summary
| Measurement | Tsimshian | German |
| Minimum | 7.3% | 0.84% |
| Maximum | 24.7% | 47.7% |
| Range | 17.4% | 46.9% |
| Mean | 13.9% | 10.7% |
| Median | 12.9% | 9.6% |
| Interquartile 25% (IQ1) | 10.5% | 7.7% |
| Interquartile 75% (IQ3) | 17.7% | 11.5% |
| Interquartile Range (IQR) | 7.2% | 3.8% |
| Standard Deviation (Sample) | 4.8% | 6.2% |
| Standard Deviation (Population) | 4.6% | 6.2% |
Similar Demographics by Poverty
Demographics Similar to Tsimshian by Poverty
In terms of poverty, the demographic groups most similar to Tsimshian are Immigrants from Eastern Africa (13.1%, a difference of 0.70%), Panamanian (13.1%, a difference of 0.82%), Ugandan (13.1%, a difference of 0.98%), Malaysian (13.1%, a difference of 1.0%), and Immigrants from the Azores (13.1%, a difference of 1.0%).
| Demographics | Rating | Rank | Poverty |
| Spanish | 18.7 /100 | #198 | Poor 12.8% |
| Immigrants | Kenya | 17.5 /100 | #199 | Poor 12.8% |
| Spaniards | 16.5 /100 | #200 | Poor 12.8% |
| Immigrants | Uganda | 16.5 /100 | #201 | Poor 12.8% |
| Immigrants | Uruguay | 15.6 /100 | #202 | Poor 12.8% |
| Hmong | 15.0 /100 | #203 | Poor 12.8% |
| Immigrants | Western Asia | 14.1 /100 | #204 | Poor 12.9% |
| Tsimshian | 9.2 /100 | #205 | Tragic 13.0% |
| Immigrants | Eastern Africa | 7.0 /100 | #206 | Tragic 13.1% |
| Panamanians | 6.6 /100 | #207 | Tragic 13.1% |
| Ugandans | 6.2 /100 | #208 | Tragic 13.1% |
| Malaysians | 6.1 /100 | #209 | Tragic 13.1% |
| Immigrants | Azores | 6.1 /100 | #210 | Tragic 13.1% |
| Moroccans | 5.2 /100 | #211 | Tragic 13.2% |
| Immigrants | Immigrants | 4.3 /100 | #212 | Tragic 13.2% |
Demographics Similar to Germans by Poverty
In terms of poverty, the demographic groups most similar to Germans are Scandinavian (11.1%, a difference of 0.060%), Estonian (11.1%, a difference of 0.10%), Immigrants from Europe (11.2%, a difference of 0.15%), Immigrants from Sri Lanka (11.2%, a difference of 0.31%), and Immigrants from Italy (11.2%, a difference of 0.37%).
| Demographics | Rating | Rank | Poverty |
| Immigrants | Croatia | 98.7 /100 | #51 | Exceptional 11.0% |
| Immigrants | Philippines | 98.7 /100 | #52 | Exceptional 11.0% |
| Immigrants | Austria | 98.6 /100 | #53 | Exceptional 11.1% |
| Immigrants | Bulgaria | 98.5 /100 | #54 | Exceptional 11.1% |
| Immigrants | Serbia | 98.5 /100 | #55 | Exceptional 11.1% |
| Estonians | 98.2 /100 | #56 | Exceptional 11.1% |
| Scandinavians | 98.2 /100 | #57 | Exceptional 11.1% |
| Germans | 98.1 /100 | #58 | Exceptional 11.1% |
| Immigrants | Europe | 98.0 /100 | #59 | Exceptional 11.2% |
| Immigrants | Sri Lanka | 97.9 /100 | #60 | Exceptional 11.2% |
| Immigrants | Italy | 97.9 /100 | #61 | Exceptional 11.2% |
| Austrians | 97.8 /100 | #62 | Exceptional 11.2% |
| Ukrainians | 97.8 /100 | #63 | Exceptional 11.2% |
| Swiss | 97.7 /100 | #64 | Exceptional 11.2% |
| Immigrants | Asia | 97.5 /100 | #65 | Exceptional 11.2% |