Immigrants from Guyana vs German Male Unemployment
COMPARE
Immigrants from Guyana
German
Male Unemployment
Male Unemployment Comparison
Immigrants from Guyana
Germans
7.1%
MALE UNEMPLOYMENT
0.0/ 100
METRIC RATING
316th/ 347
METRIC RANK
4.7%
MALE UNEMPLOYMENT
100.0/ 100
METRIC RATING
14th/ 347
METRIC RANK
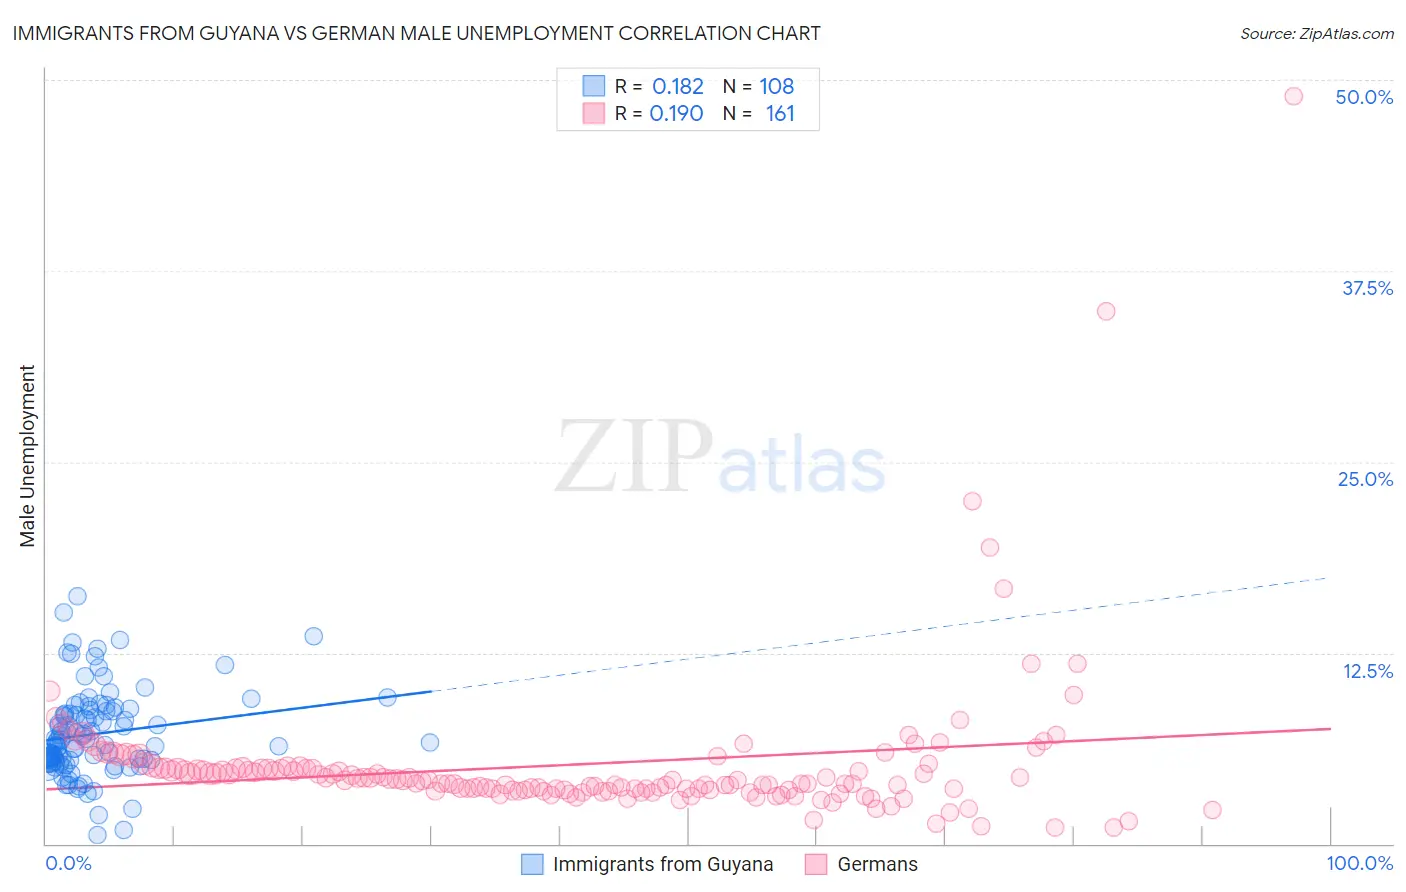
Immigrants from Guyana vs German Male Unemployment Correlation Chart
The statistical analysis conducted on geographies consisting of 183,427,886 people shows a poor positive correlation between the proportion of Immigrants from Guyana and unemployment rate among males in the United States with a correlation coefficient (R) of 0.182 and weighted average of 7.1%. Similarly, the statistical analysis conducted on geographies consisting of 567,520,747 people shows a poor positive correlation between the proportion of Germans and unemployment rate among males in the United States with a correlation coefficient (R) of 0.190 and weighted average of 4.7%, a difference of 51.5%.
Male Unemployment Correlation Summary
| Measurement | Immigrants from Guyana | German |
| Minimum | 0.60% | 1.1% |
| Maximum | 16.2% | 48.9% |
| Range | 15.6% | 47.8% |
| Mean | 7.2% | 5.2% |
| Median | 6.7% | 4.2% |
| Interquartile 25% (IQ1) | 5.4% | 3.5% |
| Interquartile 75% (IQ3) | 8.7% | 4.9% |
| Interquartile Range (IQR) | 3.3% | 1.4% |
| Standard Deviation (Sample) | 2.8% | 5.0% |
| Standard Deviation (Population) | 2.8% | 5.0% |
Similar Demographics by Male Unemployment
Demographics Similar to Immigrants from Guyana by Male Unemployment
In terms of male unemployment, the demographic groups most similar to Immigrants from Guyana are Houma (7.1%, a difference of 0.030%), Guyanese (7.1%, a difference of 0.060%), Cape Verdean (7.1%, a difference of 0.12%), Immigrants from Barbados (7.1%, a difference of 0.24%), and Immigrants from Dominica (7.0%, a difference of 1.5%).
| Demographics | Rating | Rank | Male Unemployment |
| Barbadians | 0.0 /100 | #309 | Tragic 6.9% |
| Blacks/African Americans | 0.0 /100 | #310 | Tragic 6.9% |
| Immigrants | Armenia | 0.0 /100 | #311 | Tragic 6.9% |
| Lumbee | 0.0 /100 | #312 | Tragic 6.9% |
| Immigrants | Dominica | 0.0 /100 | #313 | Tragic 7.0% |
| Immigrants | Barbados | 0.0 /100 | #314 | Tragic 7.1% |
| Houma | 0.0 /100 | #315 | Tragic 7.1% |
| Immigrants | Guyana | 0.0 /100 | #316 | Tragic 7.1% |
| Guyanese | 0.0 /100 | #317 | Tragic 7.1% |
| Cape Verdeans | 0.0 /100 | #318 | Tragic 7.1% |
| British West Indians | 0.0 /100 | #319 | Tragic 7.3% |
| Colville | 0.0 /100 | #320 | Tragic 7.4% |
| Immigrants | St. Vincent and the Grenadines | 0.0 /100 | #321 | Tragic 7.5% |
| Immigrants | Cabo Verde | 0.0 /100 | #322 | Tragic 7.5% |
| Immigrants | Grenada | 0.0 /100 | #323 | Tragic 7.6% |
Demographics Similar to Germans by Male Unemployment
In terms of male unemployment, the demographic groups most similar to Germans are Bolivian (4.7%, a difference of 0.020%), Scandinavian (4.7%, a difference of 0.27%), Swiss (4.7%, a difference of 0.32%), Immigrants from Bolivia (4.7%, a difference of 0.70%), and Filipino (4.7%, a difference of 1.1%).
| Demographics | Rating | Rank | Male Unemployment |
| Czechs | 100.0 /100 | #7 | Exceptional 4.5% |
| Luxembourgers | 100.0 /100 | #8 | Exceptional 4.5% |
| Thais | 100.0 /100 | #9 | Exceptional 4.6% |
| Cubans | 100.0 /100 | #10 | Exceptional 4.6% |
| Swedes | 100.0 /100 | #11 | Exceptional 4.6% |
| Immigrants | Bolivia | 100.0 /100 | #12 | Exceptional 4.7% |
| Bolivians | 100.0 /100 | #13 | Exceptional 4.7% |
| Germans | 100.0 /100 | #14 | Exceptional 4.7% |
| Scandinavians | 100.0 /100 | #15 | Exceptional 4.7% |
| Swiss | 99.9 /100 | #16 | Exceptional 4.7% |
| Filipinos | 99.9 /100 | #17 | Exceptional 4.7% |
| English | 99.9 /100 | #18 | Exceptional 4.8% |
| Europeans | 99.9 /100 | #19 | Exceptional 4.8% |
| Pennsylvania Germans | 99.9 /100 | #20 | Exceptional 4.8% |
| Immigrants | Taiwan | 99.9 /100 | #21 | Exceptional 4.8% |