Immigrants from Guyana vs German Unemployment Among Ages 30 to 34 years
COMPARE
Immigrants from Guyana
German
Unemployment Among Ages 30 to 34 years
Unemployment Among Ages 30 to 34 years Comparison
Immigrants from Guyana
Germans
7.2%
UNEMPLOYMENT AMONG AGES 30 TO 34 YEARS
0.0/ 100
METRIC RATING
321st/ 347
METRIC RANK
5.3%
UNEMPLOYMENT AMONG AGES 30 TO 34 YEARS
77.8/ 100
METRIC RATING
130th/ 347
METRIC RANK
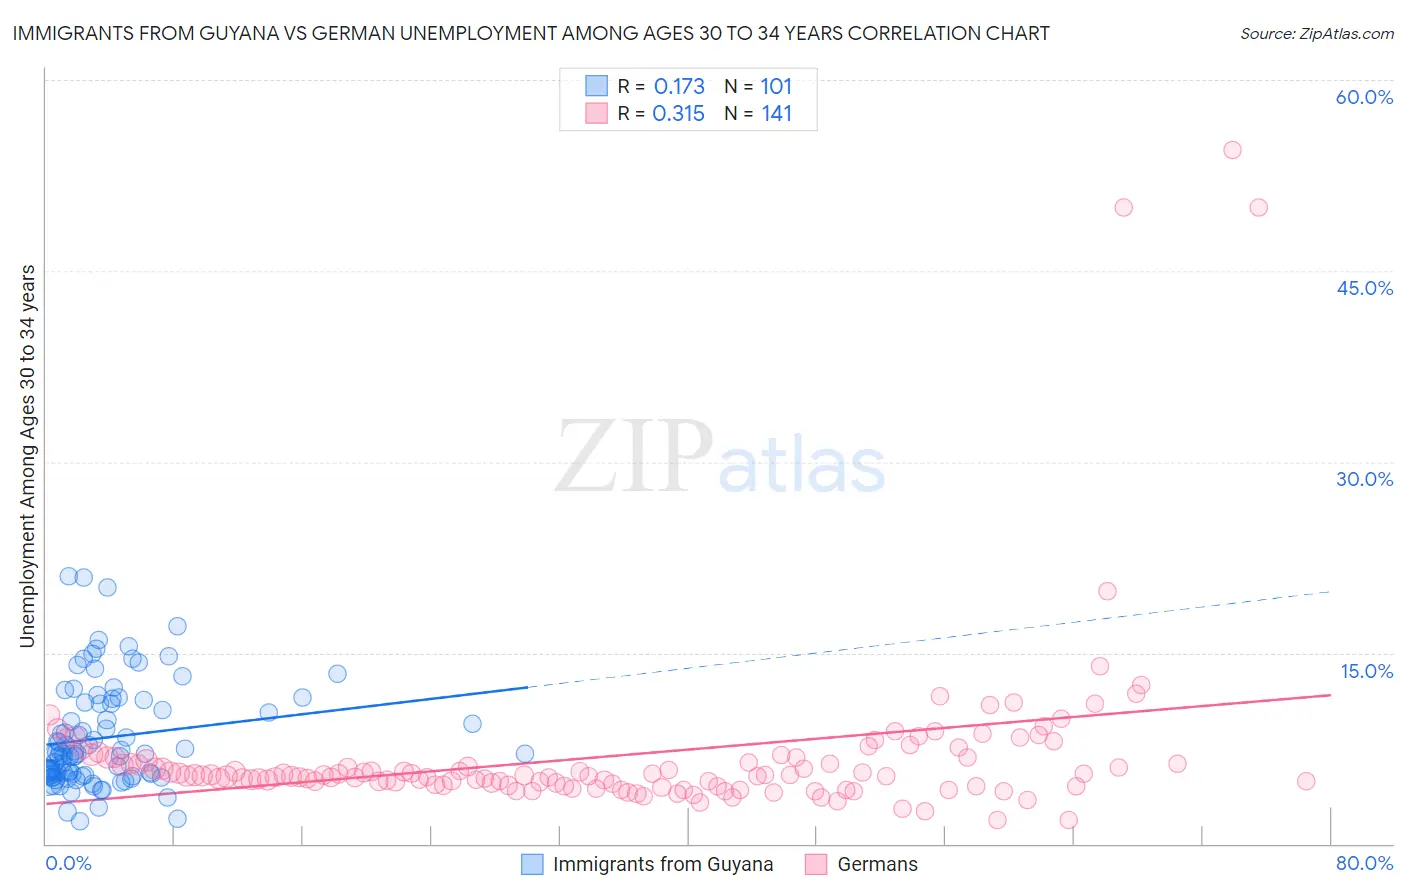
Immigrants from Guyana vs German Unemployment Among Ages 30 to 34 years Correlation Chart
The statistical analysis conducted on geographies consisting of 178,683,366 people shows a poor positive correlation between the proportion of Immigrants from Guyana and unemployment rate among population between the ages 30 and 34 in the United States with a correlation coefficient (R) of 0.173 and weighted average of 7.2%. Similarly, the statistical analysis conducted on geographies consisting of 502,645,862 people shows a mild positive correlation between the proportion of Germans and unemployment rate among population between the ages 30 and 34 in the United States with a correlation coefficient (R) of 0.315 and weighted average of 5.3%, a difference of 34.9%.
Unemployment Among Ages 30 to 34 years Correlation Summary
| Measurement | Immigrants from Guyana | German |
| Minimum | 1.8% | 1.9% |
| Maximum | 21.0% | 54.5% |
| Range | 19.2% | 52.6% |
| Mean | 8.3% | 6.9% |
| Median | 7.1% | 5.3% |
| Interquartile 25% (IQ1) | 5.4% | 4.6% |
| Interquartile 75% (IQ3) | 11.1% | 6.8% |
| Interquartile Range (IQR) | 5.6% | 2.2% |
| Standard Deviation (Sample) | 4.1% | 7.0% |
| Standard Deviation (Population) | 4.1% | 7.0% |
Similar Demographics by Unemployment Among Ages 30 to 34 years
Demographics Similar to Immigrants from Guyana by Unemployment Among Ages 30 to 34 years
In terms of unemployment among ages 30 to 34 years, the demographic groups most similar to Immigrants from Guyana are Cape Verdean (7.2%, a difference of 0.29%), Guyanese (7.2%, a difference of 0.31%), Black/African American (7.2%, a difference of 0.38%), Immigrants from Cabo Verde (7.2%, a difference of 0.48%), and Marshallese (7.2%, a difference of 0.50%).
| Demographics | Rating | Rank | Unemployment Among Ages 30 to 34 years |
| Lumbee | 0.0 /100 | #314 | Tragic 7.1% |
| Aleuts | 0.0 /100 | #315 | Tragic 7.1% |
| Houma | 0.0 /100 | #316 | Tragic 7.2% |
| Immigrants | Cabo Verde | 0.0 /100 | #317 | Tragic 7.2% |
| Blacks/African Americans | 0.0 /100 | #318 | Tragic 7.2% |
| Guyanese | 0.0 /100 | #319 | Tragic 7.2% |
| Cape Verdeans | 0.0 /100 | #320 | Tragic 7.2% |
| Immigrants | Guyana | 0.0 /100 | #321 | Tragic 7.2% |
| Marshallese | 0.0 /100 | #322 | Tragic 7.2% |
| Immigrants | Yemen | 0.0 /100 | #323 | Tragic 7.3% |
| Immigrants | Dominica | 0.0 /100 | #324 | Tragic 7.3% |
| Apache | 0.0 /100 | #325 | Tragic 7.3% |
| Dominicans | 0.0 /100 | #326 | Tragic 7.7% |
| Immigrants | Dominican Republic | 0.0 /100 | #327 | Tragic 7.7% |
| Chippewa | 0.0 /100 | #328 | Tragic 7.8% |
Demographics Similar to Germans by Unemployment Among Ages 30 to 34 years
In terms of unemployment among ages 30 to 34 years, the demographic groups most similar to Germans are Immigrants from Eastern Europe (5.3%, a difference of 0.040%), Carpatho Rusyn (5.3%, a difference of 0.050%), Immigrants from Northern Europe (5.3%, a difference of 0.050%), Polish (5.3%, a difference of 0.10%), and Bangladeshi (5.3%, a difference of 0.12%).
| Demographics | Rating | Rank | Unemployment Among Ages 30 to 34 years |
| Immigrants | Italy | 81.1 /100 | #123 | Excellent 5.3% |
| Immigrants | Brazil | 80.8 /100 | #124 | Excellent 5.3% |
| Greeks | 80.4 /100 | #125 | Excellent 5.3% |
| Immigrants | Sri Lanka | 80.2 /100 | #126 | Excellent 5.3% |
| Taiwanese | 79.4 /100 | #127 | Good 5.3% |
| Immigrants | Uruguay | 79.3 /100 | #128 | Good 5.3% |
| Poles | 78.8 /100 | #129 | Good 5.3% |
| Germans | 77.8 /100 | #130 | Good 5.3% |
| Immigrants | Eastern Europe | 77.4 /100 | #131 | Good 5.3% |
| Carpatho Rusyns | 77.3 /100 | #132 | Good 5.3% |
| Immigrants | Northern Europe | 77.3 /100 | #133 | Good 5.3% |
| Bangladeshis | 76.6 /100 | #134 | Good 5.3% |
| Palestinians | 75.1 /100 | #135 | Good 5.4% |
| Pakistanis | 74.6 /100 | #136 | Good 5.4% |
| Immigrants | Canada | 74.6 /100 | #137 | Good 5.4% |