Immigrants from Guyana vs Carpatho Rusyn Child Poverty Under the Age of 5
COMPARE
Immigrants from Guyana
Carpatho Rusyn
Child Poverty Under the Age of 5
Child Poverty Under the Age of 5 Comparison
Immigrants from Guyana
Carpatho Rusyns
19.6%
CHILD POVERTY UNDER THE AGE OF 5
0.5/ 100
METRIC RATING
242nd/ 347
METRIC RANK
17.5%
CHILD POVERTY UNDER THE AGE OF 5
33.6/ 100
METRIC RATING
188th/ 347
METRIC RANK
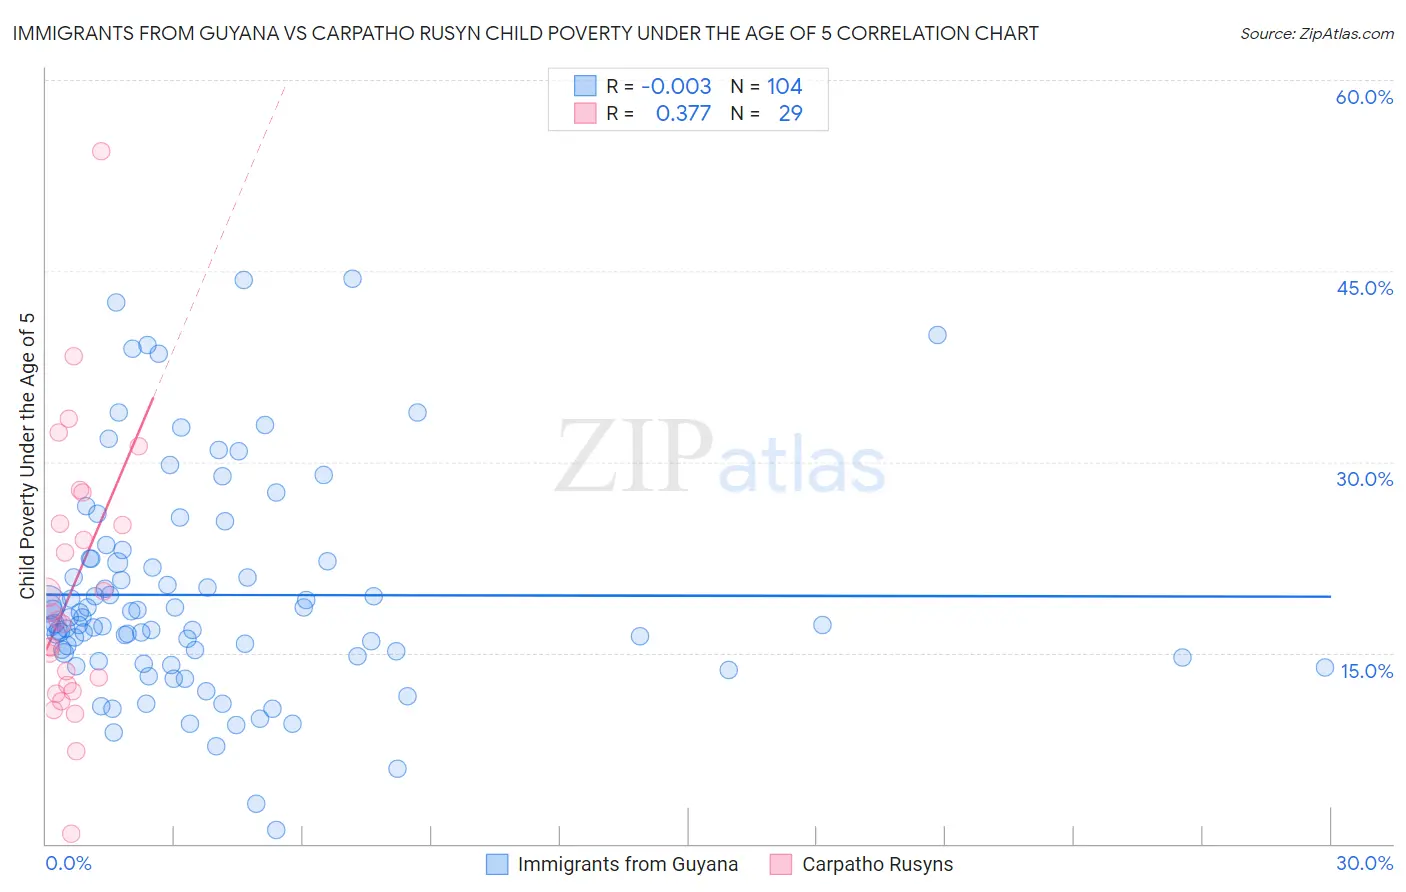
Immigrants from Guyana vs Carpatho Rusyn Child Poverty Under the Age of 5 Correlation Chart
The statistical analysis conducted on geographies consisting of 179,217,429 people shows no correlation between the proportion of Immigrants from Guyana and poverty level among children under the age of 5 in the United States with a correlation coefficient (R) of -0.003 and weighted average of 19.6%. Similarly, the statistical analysis conducted on geographies consisting of 57,729,795 people shows a mild positive correlation between the proportion of Carpatho Rusyns and poverty level among children under the age of 5 in the United States with a correlation coefficient (R) of 0.377 and weighted average of 17.5%, a difference of 11.9%.
Child Poverty Under the Age of 5 Correlation Summary
| Measurement | Immigrants from Guyana | Carpatho Rusyn |
| Minimum | 1.1% | 0.75% |
| Maximum | 44.4% | 54.4% |
| Range | 43.2% | 53.6% |
| Mean | 19.5% | 20.1% |
| Median | 17.2% | 17.6% |
| Interquartile 25% (IQ1) | 14.7% | 12.2% |
| Interquartile 75% (IQ3) | 22.3% | 26.4% |
| Interquartile Range (IQR) | 7.6% | 14.1% |
| Standard Deviation (Sample) | 8.6% | 10.9% |
| Standard Deviation (Population) | 8.6% | 10.7% |
Similar Demographics by Child Poverty Under the Age of 5
Demographics Similar to Immigrants from Guyana by Child Poverty Under the Age of 5
In terms of child poverty under the age of 5, the demographic groups most similar to Immigrants from Guyana are Osage (19.6%, a difference of 0.10%), Alaska Native (19.6%, a difference of 0.11%), Immigrants from Ghana (19.6%, a difference of 0.12%), Immigrants from Ecuador (19.6%, a difference of 0.18%), and Immigrants from Western Africa (19.7%, a difference of 0.31%).
| Demographics | Rating | Rank | Child Poverty Under the Age of 5 |
| Immigrants | Laos | 0.8 /100 | #235 | Tragic 19.4% |
| Immigrants | Trinidad and Tobago | 0.8 /100 | #236 | Tragic 19.4% |
| Immigrants | Cabo Verde | 0.6 /100 | #237 | Tragic 19.5% |
| Salvadorans | 0.6 /100 | #238 | Tragic 19.5% |
| Vietnamese | 0.6 /100 | #239 | Tragic 19.5% |
| Immigrants | Ecuador | 0.5 /100 | #240 | Tragic 19.6% |
| Alaska Natives | 0.5 /100 | #241 | Tragic 19.6% |
| Immigrants | Guyana | 0.5 /100 | #242 | Tragic 19.6% |
| Osage | 0.5 /100 | #243 | Tragic 19.6% |
| Immigrants | Ghana | 0.5 /100 | #244 | Tragic 19.6% |
| Immigrants | Western Africa | 0.4 /100 | #245 | Tragic 19.7% |
| Cree | 0.4 /100 | #246 | Tragic 19.7% |
| Guyanese | 0.4 /100 | #247 | Tragic 19.7% |
| Marshallese | 0.4 /100 | #248 | Tragic 19.7% |
| Immigrants | Middle Africa | 0.4 /100 | #249 | Tragic 19.7% |
Demographics Similar to Carpatho Rusyns by Child Poverty Under the Age of 5
In terms of child poverty under the age of 5, the demographic groups most similar to Carpatho Rusyns are French (17.5%, a difference of 0.010%), Kenyan (17.5%, a difference of 0.12%), Immigrants from Bosnia and Herzegovina (17.5%, a difference of 0.16%), Immigrants from Armenia (17.5%, a difference of 0.49%), and Slovak (17.6%, a difference of 0.53%).
| Demographics | Rating | Rank | Child Poverty Under the Age of 5 |
| Immigrants | Germany | 41.0 /100 | #181 | Average 17.4% |
| Arabs | 40.7 /100 | #182 | Average 17.4% |
| Lebanese | 40.3 /100 | #183 | Average 17.4% |
| Immigrants | Costa Rica | 39.0 /100 | #184 | Fair 17.4% |
| Immigrants | Armenia | 38.0 /100 | #185 | Fair 17.5% |
| Immigrants | Bosnia and Herzegovina | 35.0 /100 | #186 | Fair 17.5% |
| Kenyans | 34.7 /100 | #187 | Fair 17.5% |
| Carpatho Rusyns | 33.6 /100 | #188 | Fair 17.5% |
| French | 33.6 /100 | #189 | Fair 17.5% |
| Slovaks | 29.2 /100 | #190 | Fair 17.6% |
| Immigrants | Afghanistan | 27.9 /100 | #191 | Fair 17.7% |
| Immigrants | Uruguay | 27.8 /100 | #192 | Fair 17.7% |
| Immigrants | Uganda | 25.0 /100 | #193 | Fair 17.7% |
| French Canadians | 24.6 /100 | #194 | Fair 17.7% |
| Sierra Leoneans | 24.1 /100 | #195 | Fair 17.7% |