Immigrants from Guyana vs Black/African American Child Poverty Under the Age of 5
COMPARE
Immigrants from Guyana
Black/African American
Child Poverty Under the Age of 5
Child Poverty Under the Age of 5 Comparison
Immigrants from Guyana
Blacks/African Americans
19.6%
CHILD POVERTY UNDER THE AGE OF 5
0.5/ 100
METRIC RATING
242nd/ 347
METRIC RANK
25.7%
CHILD POVERTY UNDER THE AGE OF 5
0.0/ 100
METRIC RATING
334th/ 347
METRIC RANK
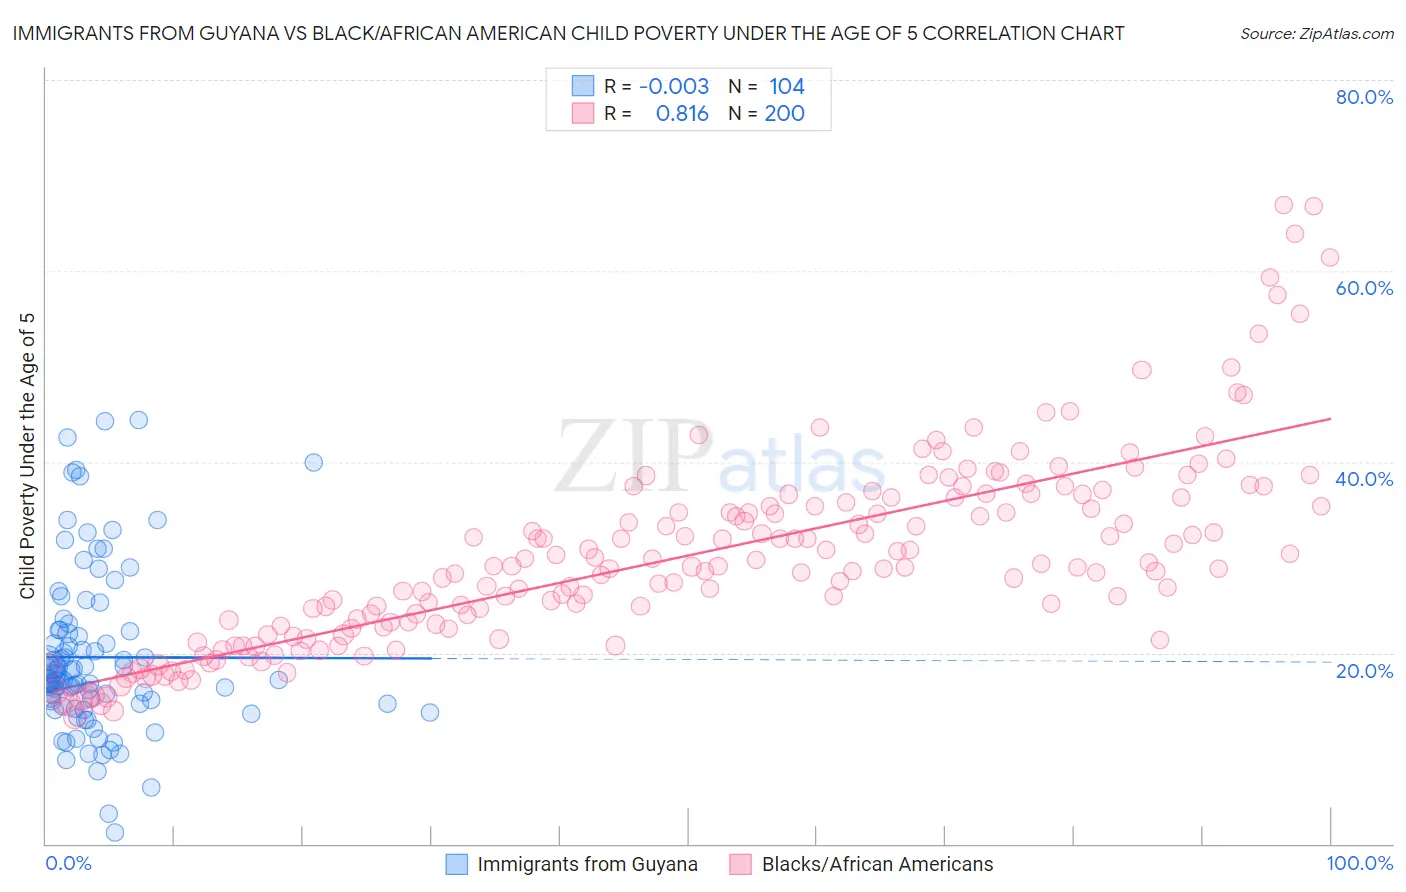
Immigrants from Guyana vs Black/African American Child Poverty Under the Age of 5 Correlation Chart
The statistical analysis conducted on geographies consisting of 179,217,429 people shows no correlation between the proportion of Immigrants from Guyana and poverty level among children under the age of 5 in the United States with a correlation coefficient (R) of -0.003 and weighted average of 19.6%. Similarly, the statistical analysis conducted on geographies consisting of 529,558,738 people shows a very strong positive correlation between the proportion of Blacks/African Americans and poverty level among children under the age of 5 in the United States with a correlation coefficient (R) of 0.816 and weighted average of 25.7%, a difference of 30.9%.
Child Poverty Under the Age of 5 Correlation Summary
| Measurement | Immigrants from Guyana | Black/African American |
| Minimum | 1.1% | 13.3% |
| Maximum | 44.4% | 66.9% |
| Range | 43.2% | 53.6% |
| Mean | 19.5% | 30.2% |
| Median | 17.2% | 29.0% |
| Interquartile 25% (IQ1) | 14.7% | 22.7% |
| Interquartile 75% (IQ3) | 22.3% | 36.0% |
| Interquartile Range (IQR) | 7.6% | 13.2% |
| Standard Deviation (Sample) | 8.6% | 10.2% |
| Standard Deviation (Population) | 8.6% | 10.1% |
Similar Demographics by Child Poverty Under the Age of 5
Demographics Similar to Immigrants from Guyana by Child Poverty Under the Age of 5
In terms of child poverty under the age of 5, the demographic groups most similar to Immigrants from Guyana are Osage (19.6%, a difference of 0.10%), Alaska Native (19.6%, a difference of 0.11%), Immigrants from Ghana (19.6%, a difference of 0.12%), Immigrants from Ecuador (19.6%, a difference of 0.18%), and Immigrants from Western Africa (19.7%, a difference of 0.31%).
| Demographics | Rating | Rank | Child Poverty Under the Age of 5 |
| Immigrants | Laos | 0.8 /100 | #235 | Tragic 19.4% |
| Immigrants | Trinidad and Tobago | 0.8 /100 | #236 | Tragic 19.4% |
| Immigrants | Cabo Verde | 0.6 /100 | #237 | Tragic 19.5% |
| Salvadorans | 0.6 /100 | #238 | Tragic 19.5% |
| Vietnamese | 0.6 /100 | #239 | Tragic 19.5% |
| Immigrants | Ecuador | 0.5 /100 | #240 | Tragic 19.6% |
| Alaska Natives | 0.5 /100 | #241 | Tragic 19.6% |
| Immigrants | Guyana | 0.5 /100 | #242 | Tragic 19.6% |
| Osage | 0.5 /100 | #243 | Tragic 19.6% |
| Immigrants | Ghana | 0.5 /100 | #244 | Tragic 19.6% |
| Immigrants | Western Africa | 0.4 /100 | #245 | Tragic 19.7% |
| Cree | 0.4 /100 | #246 | Tragic 19.7% |
| Guyanese | 0.4 /100 | #247 | Tragic 19.7% |
| Marshallese | 0.4 /100 | #248 | Tragic 19.7% |
| Immigrants | Middle Africa | 0.4 /100 | #249 | Tragic 19.7% |
Demographics Similar to Blacks/African Americans by Child Poverty Under the Age of 5
In terms of child poverty under the age of 5, the demographic groups most similar to Blacks/African Americans are Colville (25.7%, a difference of 0.0%), Native/Alaskan (25.6%, a difference of 0.50%), Apache (25.0%, a difference of 2.8%), Sioux (26.9%, a difference of 4.9%), and Kiowa (24.5%, a difference of 5.0%).
| Demographics | Rating | Rank | Child Poverty Under the Age of 5 |
| Dominicans | 0.0 /100 | #327 | Tragic 24.0% |
| Immigrants | Dominican Republic | 0.0 /100 | #328 | Tragic 24.1% |
| Cajuns | 0.0 /100 | #329 | Tragic 24.1% |
| Creek | 0.0 /100 | #330 | Tragic 24.2% |
| Kiowa | 0.0 /100 | #331 | Tragic 24.5% |
| Apache | 0.0 /100 | #332 | Tragic 25.0% |
| Natives/Alaskans | 0.0 /100 | #333 | Tragic 25.6% |
| Blacks/African Americans | 0.0 /100 | #334 | Tragic 25.7% |
| Colville | 0.0 /100 | #335 | Tragic 25.7% |
| Sioux | 0.0 /100 | #336 | Tragic 26.9% |
| Pima | 0.0 /100 | #337 | Tragic 27.4% |
| Hopi | 0.0 /100 | #338 | Tragic 27.7% |
| Yup'ik | 0.0 /100 | #339 | Tragic 27.7% |
| Cheyenne | 0.0 /100 | #340 | Tragic 28.3% |
| Immigrants | Yemen | 0.0 /100 | #341 | Tragic 29.3% |