Immigrants from Guyana vs Cheyenne Child Poverty Under the Age of 5
COMPARE
Immigrants from Guyana
Cheyenne
Child Poverty Under the Age of 5
Child Poverty Under the Age of 5 Comparison
Immigrants from Guyana
Cheyenne
19.6%
CHILD POVERTY UNDER THE AGE OF 5
0.5/ 100
METRIC RATING
242nd/ 347
METRIC RANK
28.3%
CHILD POVERTY UNDER THE AGE OF 5
0.0/ 100
METRIC RATING
340th/ 347
METRIC RANK
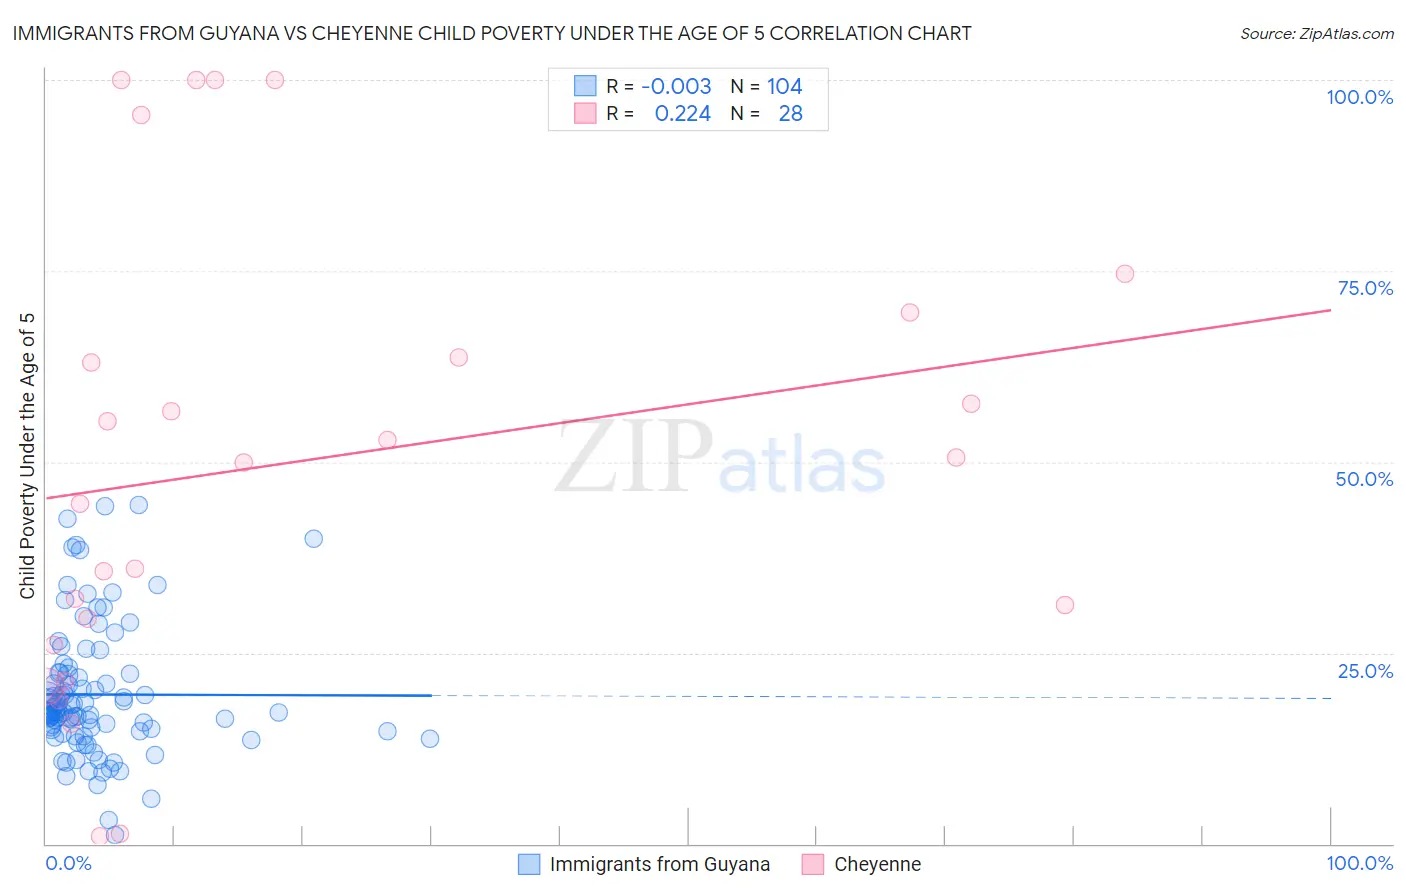
Immigrants from Guyana vs Cheyenne Child Poverty Under the Age of 5 Correlation Chart
The statistical analysis conducted on geographies consisting of 179,217,429 people shows no correlation between the proportion of Immigrants from Guyana and poverty level among children under the age of 5 in the United States with a correlation coefficient (R) of -0.003 and weighted average of 19.6%. Similarly, the statistical analysis conducted on geographies consisting of 80,047,765 people shows a weak positive correlation between the proportion of Cheyenne and poverty level among children under the age of 5 in the United States with a correlation coefficient (R) of 0.224 and weighted average of 28.3%, a difference of 44.4%.
Child Poverty Under the Age of 5 Correlation Summary
| Measurement | Immigrants from Guyana | Cheyenne |
| Minimum | 1.1% | 1.0% |
| Maximum | 44.4% | 100.0% |
| Range | 43.2% | 99.0% |
| Mean | 19.5% | 50.1% |
| Median | 17.2% | 50.3% |
| Interquartile 25% (IQ1) | 14.7% | 27.8% |
| Interquartile 75% (IQ3) | 22.3% | 66.6% |
| Interquartile Range (IQR) | 7.6% | 38.9% |
| Standard Deviation (Sample) | 8.6% | 30.0% |
| Standard Deviation (Population) | 8.6% | 29.4% |
Similar Demographics by Child Poverty Under the Age of 5
Demographics Similar to Immigrants from Guyana by Child Poverty Under the Age of 5
In terms of child poverty under the age of 5, the demographic groups most similar to Immigrants from Guyana are Osage (19.6%, a difference of 0.10%), Alaska Native (19.6%, a difference of 0.11%), Immigrants from Ghana (19.6%, a difference of 0.12%), Immigrants from Ecuador (19.6%, a difference of 0.18%), and Immigrants from Western Africa (19.7%, a difference of 0.31%).
| Demographics | Rating | Rank | Child Poverty Under the Age of 5 |
| Immigrants | Laos | 0.8 /100 | #235 | Tragic 19.4% |
| Immigrants | Trinidad and Tobago | 0.8 /100 | #236 | Tragic 19.4% |
| Immigrants | Cabo Verde | 0.6 /100 | #237 | Tragic 19.5% |
| Salvadorans | 0.6 /100 | #238 | Tragic 19.5% |
| Vietnamese | 0.6 /100 | #239 | Tragic 19.5% |
| Immigrants | Ecuador | 0.5 /100 | #240 | Tragic 19.6% |
| Alaska Natives | 0.5 /100 | #241 | Tragic 19.6% |
| Immigrants | Guyana | 0.5 /100 | #242 | Tragic 19.6% |
| Osage | 0.5 /100 | #243 | Tragic 19.6% |
| Immigrants | Ghana | 0.5 /100 | #244 | Tragic 19.6% |
| Immigrants | Western Africa | 0.4 /100 | #245 | Tragic 19.7% |
| Cree | 0.4 /100 | #246 | Tragic 19.7% |
| Guyanese | 0.4 /100 | #247 | Tragic 19.7% |
| Marshallese | 0.4 /100 | #248 | Tragic 19.7% |
| Immigrants | Middle Africa | 0.4 /100 | #249 | Tragic 19.7% |
Demographics Similar to Cheyenne by Child Poverty Under the Age of 5
In terms of child poverty under the age of 5, the demographic groups most similar to Cheyenne are Yup'ik (27.7%, a difference of 2.2%), Hopi (27.7%, a difference of 2.3%), Pima (27.4%, a difference of 3.3%), Immigrants from Yemen (29.3%, a difference of 3.4%), and Tohono O'odham (29.5%, a difference of 4.1%).
| Demographics | Rating | Rank | Child Poverty Under the Age of 5 |
| Natives/Alaskans | 0.0 /100 | #333 | Tragic 25.6% |
| Blacks/African Americans | 0.0 /100 | #334 | Tragic 25.7% |
| Colville | 0.0 /100 | #335 | Tragic 25.7% |
| Sioux | 0.0 /100 | #336 | Tragic 26.9% |
| Pima | 0.0 /100 | #337 | Tragic 27.4% |
| Hopi | 0.0 /100 | #338 | Tragic 27.7% |
| Yup'ik | 0.0 /100 | #339 | Tragic 27.7% |
| Cheyenne | 0.0 /100 | #340 | Tragic 28.3% |
| Immigrants | Yemen | 0.0 /100 | #341 | Tragic 29.3% |
| Tohono O'odham | 0.0 /100 | #342 | Tragic 29.5% |
| Yuman | 0.0 /100 | #343 | Tragic 29.5% |
| Crow | 0.0 /100 | #344 | Tragic 31.0% |
| Navajo | 0.0 /100 | #345 | Tragic 31.6% |
| Lumbee | 0.0 /100 | #346 | Tragic 33.3% |
| Puerto Ricans | 0.0 /100 | #347 | Tragic 34.5% |