Immigrants from Guyana vs Carpatho Rusyn Currently Married
COMPARE
Immigrants from Guyana
Carpatho Rusyn
Currently Married
Currently Married Comparison
Immigrants from Guyana
Carpatho Rusyns
41.9%
CURRENTLY MARRIED
0.0/ 100
METRIC RATING
306th/ 347
METRIC RANK
47.0%
CURRENTLY MARRIED
72.6/ 100
METRIC RATING
146th/ 347
METRIC RANK
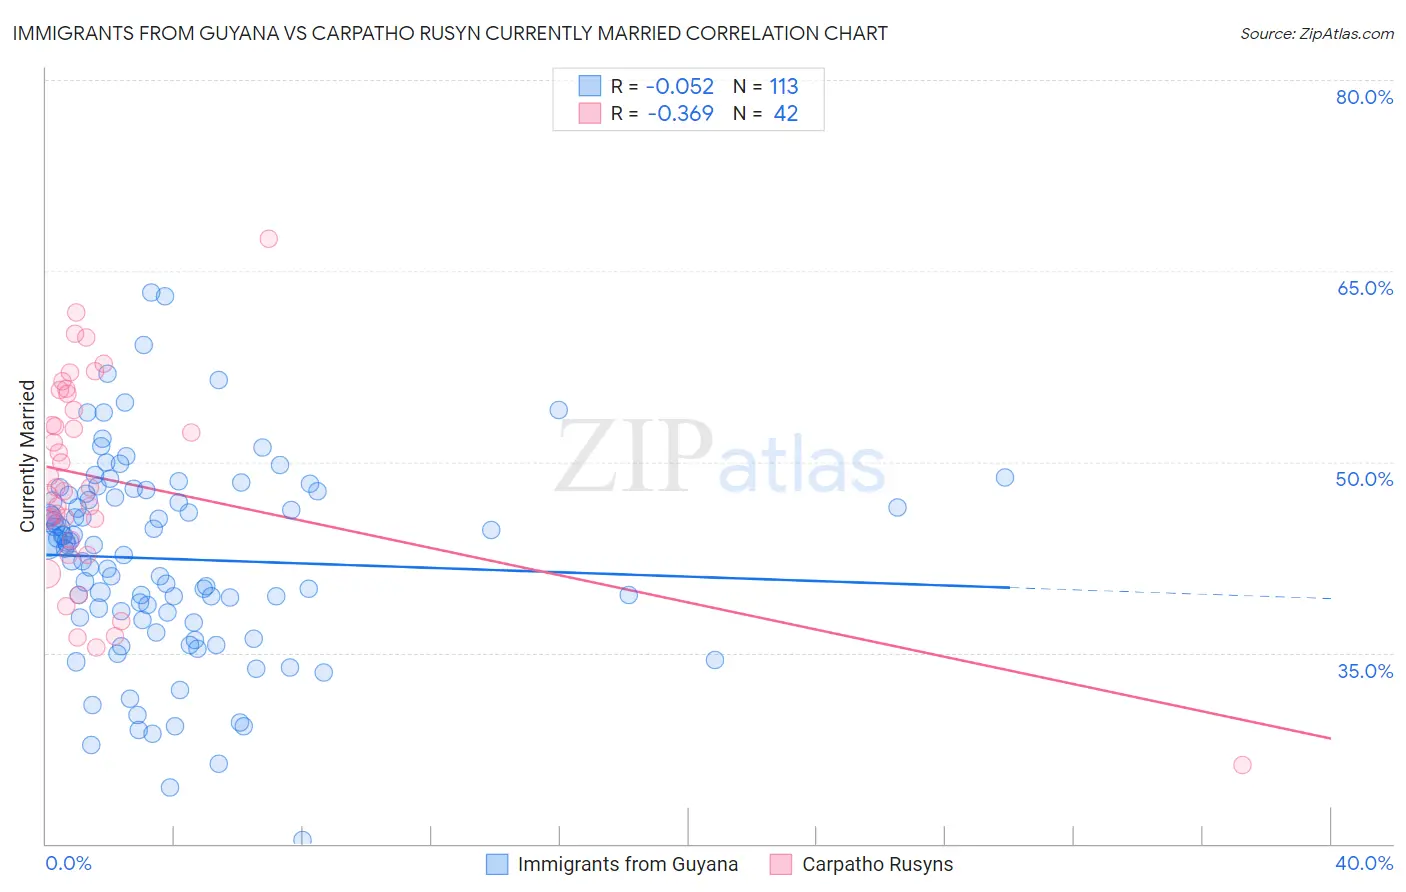
Immigrants from Guyana vs Carpatho Rusyn Currently Married Correlation Chart
The statistical analysis conducted on geographies consisting of 183,739,040 people shows a slight negative correlation between the proportion of Immigrants from Guyana and percentage of population currently married in the United States with a correlation coefficient (R) of -0.052 and weighted average of 41.9%. Similarly, the statistical analysis conducted on geographies consisting of 58,871,690 people shows a mild negative correlation between the proportion of Carpatho Rusyns and percentage of population currently married in the United States with a correlation coefficient (R) of -0.369 and weighted average of 47.0%, a difference of 12.3%.
Currently Married Correlation Summary
| Measurement | Immigrants from Guyana | Carpatho Rusyn |
| Minimum | 20.3% | 26.2% |
| Maximum | 63.3% | 67.5% |
| Range | 43.0% | 41.3% |
| Mean | 42.4% | 48.6% |
| Median | 43.5% | 48.0% |
| Interquartile 25% (IQ1) | 37.7% | 43.8% |
| Interquartile 75% (IQ3) | 47.5% | 55.3% |
| Interquartile Range (IQR) | 9.8% | 11.5% |
| Standard Deviation (Sample) | 7.9% | 8.3% |
| Standard Deviation (Population) | 7.8% | 8.2% |
Similar Demographics by Currently Married
Demographics Similar to Immigrants from Guyana by Currently Married
In terms of currently married, the demographic groups most similar to Immigrants from Guyana are Immigrants from Trinidad and Tobago (41.9%, a difference of 0.010%), Immigrants from Bahamas (41.9%, a difference of 0.040%), African (41.8%, a difference of 0.13%), Sioux (41.9%, a difference of 0.16%), and Immigrants from Zaire (42.0%, a difference of 0.17%).
| Demographics | Rating | Rank | Currently Married |
| Liberians | 0.0 /100 | #299 | Tragic 42.2% |
| Belizeans | 0.0 /100 | #300 | Tragic 42.2% |
| Immigrants | Yemen | 0.0 /100 | #301 | Tragic 42.1% |
| Immigrants | Zaire | 0.0 /100 | #302 | Tragic 42.0% |
| Sioux | 0.0 /100 | #303 | Tragic 41.9% |
| Immigrants | Bahamas | 0.0 /100 | #304 | Tragic 41.9% |
| Immigrants | Trinidad and Tobago | 0.0 /100 | #305 | Tragic 41.9% |
| Immigrants | Guyana | 0.0 /100 | #306 | Tragic 41.9% |
| Africans | 0.0 /100 | #307 | Tragic 41.8% |
| Immigrants | Belize | 0.0 /100 | #308 | Tragic 41.8% |
| Immigrants | Liberia | 0.0 /100 | #309 | Tragic 41.8% |
| Guyanese | 0.0 /100 | #310 | Tragic 41.6% |
| Trinidadians and Tobagonians | 0.0 /100 | #311 | Tragic 41.5% |
| Somalis | 0.0 /100 | #312 | Tragic 41.5% |
| Jamaicans | 0.0 /100 | #313 | Tragic 41.4% |
Demographics Similar to Carpatho Rusyns by Currently Married
In terms of currently married, the demographic groups most similar to Carpatho Rusyns are Immigrants from South Eastern Asia (47.1%, a difference of 0.010%), Immigrants from Argentina (47.0%, a difference of 0.030%), Hmong (47.1%, a difference of 0.040%), Guamanian/Chamorro (47.1%, a difference of 0.070%), and Venezuelan (47.1%, a difference of 0.080%).
| Demographics | Rating | Rank | Currently Married |
| Yugoslavians | 77.4 /100 | #139 | Good 47.2% |
| Cajuns | 75.3 /100 | #140 | Good 47.1% |
| Venezuelans | 74.4 /100 | #141 | Good 47.1% |
| Argentineans | 74.4 /100 | #142 | Good 47.1% |
| Guamanians/Chamorros | 74.2 /100 | #143 | Good 47.1% |
| Hmong | 73.4 /100 | #144 | Good 47.1% |
| Immigrants | South Eastern Asia | 72.9 /100 | #145 | Good 47.1% |
| Carpatho Rusyns | 72.6 /100 | #146 | Good 47.0% |
| Immigrants | Argentina | 72.0 /100 | #147 | Good 47.0% |
| Cambodians | 70.4 /100 | #148 | Good 47.0% |
| Zimbabweans | 70.1 /100 | #149 | Good 47.0% |
| Immigrants | Turkey | 70.0 /100 | #150 | Good 47.0% |
| Chileans | 69.8 /100 | #151 | Good 47.0% |
| Immigrants | Serbia | 68.8 /100 | #152 | Good 47.0% |
| Immigrants | Venezuela | 68.6 /100 | #153 | Good 47.0% |