Immigrants from Guyana vs Immigrants from Senegal Child Poverty Under the Age of 5
COMPARE
Immigrants from Guyana
Immigrants from Senegal
Child Poverty Under the Age of 5
Child Poverty Under the Age of 5 Comparison
Immigrants from Guyana
Immigrants from Senegal
19.6%
CHILD POVERTY UNDER THE AGE OF 5
0.5/ 100
METRIC RATING
242nd/ 347
METRIC RANK
21.3%
CHILD POVERTY UNDER THE AGE OF 5
0.0/ 100
METRIC RATING
288th/ 347
METRIC RANK
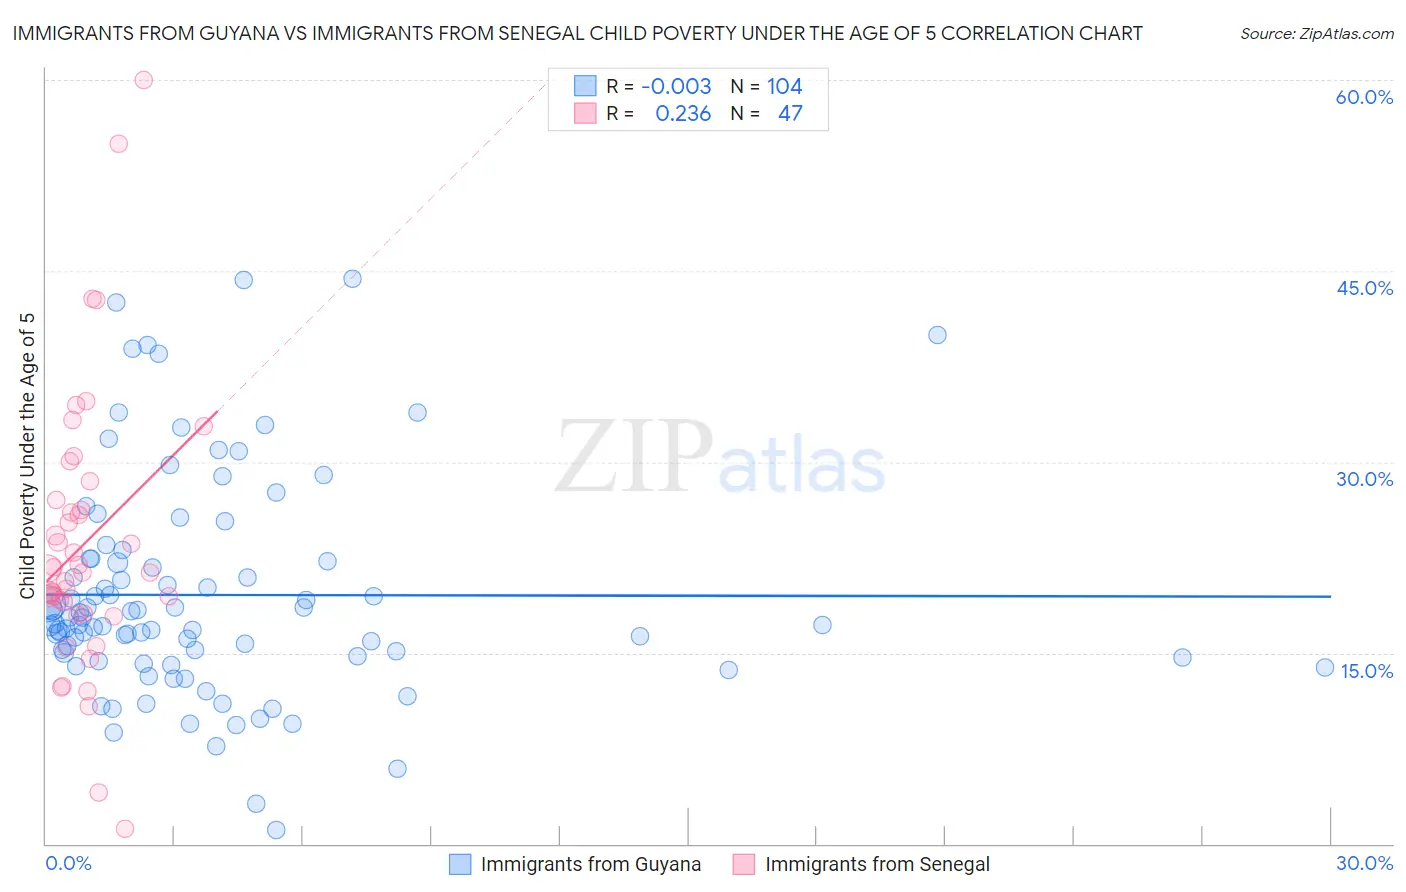
Immigrants from Guyana vs Immigrants from Senegal Child Poverty Under the Age of 5 Correlation Chart
The statistical analysis conducted on geographies consisting of 179,217,429 people shows no correlation between the proportion of Immigrants from Guyana and poverty level among children under the age of 5 in the United States with a correlation coefficient (R) of -0.003 and weighted average of 19.6%. Similarly, the statistical analysis conducted on geographies consisting of 89,495,365 people shows a weak positive correlation between the proportion of Immigrants from Senegal and poverty level among children under the age of 5 in the United States with a correlation coefficient (R) of 0.236 and weighted average of 21.3%, a difference of 8.5%.
Child Poverty Under the Age of 5 Correlation Summary
| Measurement | Immigrants from Guyana | Immigrants from Senegal |
| Minimum | 1.1% | 1.2% |
| Maximum | 44.4% | 60.0% |
| Range | 43.2% | 58.8% |
| Mean | 19.5% | 23.5% |
| Median | 17.2% | 21.4% |
| Interquartile 25% (IQ1) | 14.7% | 18.1% |
| Interquartile 75% (IQ3) | 22.3% | 27.0% |
| Interquartile Range (IQR) | 7.6% | 8.9% |
| Standard Deviation (Sample) | 8.6% | 11.0% |
| Standard Deviation (Population) | 8.6% | 10.9% |
Similar Demographics by Child Poverty Under the Age of 5
Demographics Similar to Immigrants from Guyana by Child Poverty Under the Age of 5
In terms of child poverty under the age of 5, the demographic groups most similar to Immigrants from Guyana are Osage (19.6%, a difference of 0.10%), Alaska Native (19.6%, a difference of 0.11%), Immigrants from Ghana (19.6%, a difference of 0.12%), Immigrants from Ecuador (19.6%, a difference of 0.18%), and Immigrants from Western Africa (19.7%, a difference of 0.31%).
| Demographics | Rating | Rank | Child Poverty Under the Age of 5 |
| Immigrants | Laos | 0.8 /100 | #235 | Tragic 19.4% |
| Immigrants | Trinidad and Tobago | 0.8 /100 | #236 | Tragic 19.4% |
| Immigrants | Cabo Verde | 0.6 /100 | #237 | Tragic 19.5% |
| Salvadorans | 0.6 /100 | #238 | Tragic 19.5% |
| Vietnamese | 0.6 /100 | #239 | Tragic 19.5% |
| Immigrants | Ecuador | 0.5 /100 | #240 | Tragic 19.6% |
| Alaska Natives | 0.5 /100 | #241 | Tragic 19.6% |
| Immigrants | Guyana | 0.5 /100 | #242 | Tragic 19.6% |
| Osage | 0.5 /100 | #243 | Tragic 19.6% |
| Immigrants | Ghana | 0.5 /100 | #244 | Tragic 19.6% |
| Immigrants | Western Africa | 0.4 /100 | #245 | Tragic 19.7% |
| Cree | 0.4 /100 | #246 | Tragic 19.7% |
| Guyanese | 0.4 /100 | #247 | Tragic 19.7% |
| Marshallese | 0.4 /100 | #248 | Tragic 19.7% |
| Immigrants | Middle Africa | 0.4 /100 | #249 | Tragic 19.7% |
Demographics Similar to Immigrants from Senegal by Child Poverty Under the Age of 5
In terms of child poverty under the age of 5, the demographic groups most similar to Immigrants from Senegal are Immigrants from Haiti (21.3%, a difference of 0.070%), Immigrants from Zaire (21.3%, a difference of 0.17%), Immigrants from Latin America (21.2%, a difference of 0.27%), Haitian (21.2%, a difference of 0.34%), and Immigrants from Caribbean (21.4%, a difference of 0.48%).
| Demographics | Rating | Rank | Child Poverty Under the Age of 5 |
| Senegalese | 0.0 /100 | #281 | Tragic 20.9% |
| Potawatomi | 0.0 /100 | #282 | Tragic 21.0% |
| Comanche | 0.0 /100 | #283 | Tragic 21.0% |
| Somalis | 0.0 /100 | #284 | Tragic 21.1% |
| Haitians | 0.0 /100 | #285 | Tragic 21.2% |
| Immigrants | Latin America | 0.0 /100 | #286 | Tragic 21.2% |
| Immigrants | Zaire | 0.0 /100 | #287 | Tragic 21.3% |
| Immigrants | Senegal | 0.0 /100 | #288 | Tragic 21.3% |
| Immigrants | Haiti | 0.0 /100 | #289 | Tragic 21.3% |
| Immigrants | Caribbean | 0.0 /100 | #290 | Tragic 21.4% |
| British West Indians | 0.0 /100 | #291 | Tragic 21.4% |
| Immigrants | Somalia | 0.0 /100 | #292 | Tragic 21.6% |
| Mexicans | 0.0 /100 | #293 | Tragic 21.6% |
| Guatemalans | 0.0 /100 | #294 | Tragic 21.6% |
| Cherokee | 0.0 /100 | #295 | Tragic 21.7% |