Jordanian vs Carpatho Rusyn Child Poverty Under the Age of 5
COMPARE
Jordanian
Carpatho Rusyn
Child Poverty Under the Age of 5
Child Poverty Under the Age of 5 Comparison
Jordanians
Carpatho Rusyns
15.6%
CHILD POVERTY UNDER THE AGE OF 5
97.3/ 100
METRIC RATING
88th/ 347
METRIC RANK
17.5%
CHILD POVERTY UNDER THE AGE OF 5
33.6/ 100
METRIC RATING
188th/ 347
METRIC RANK
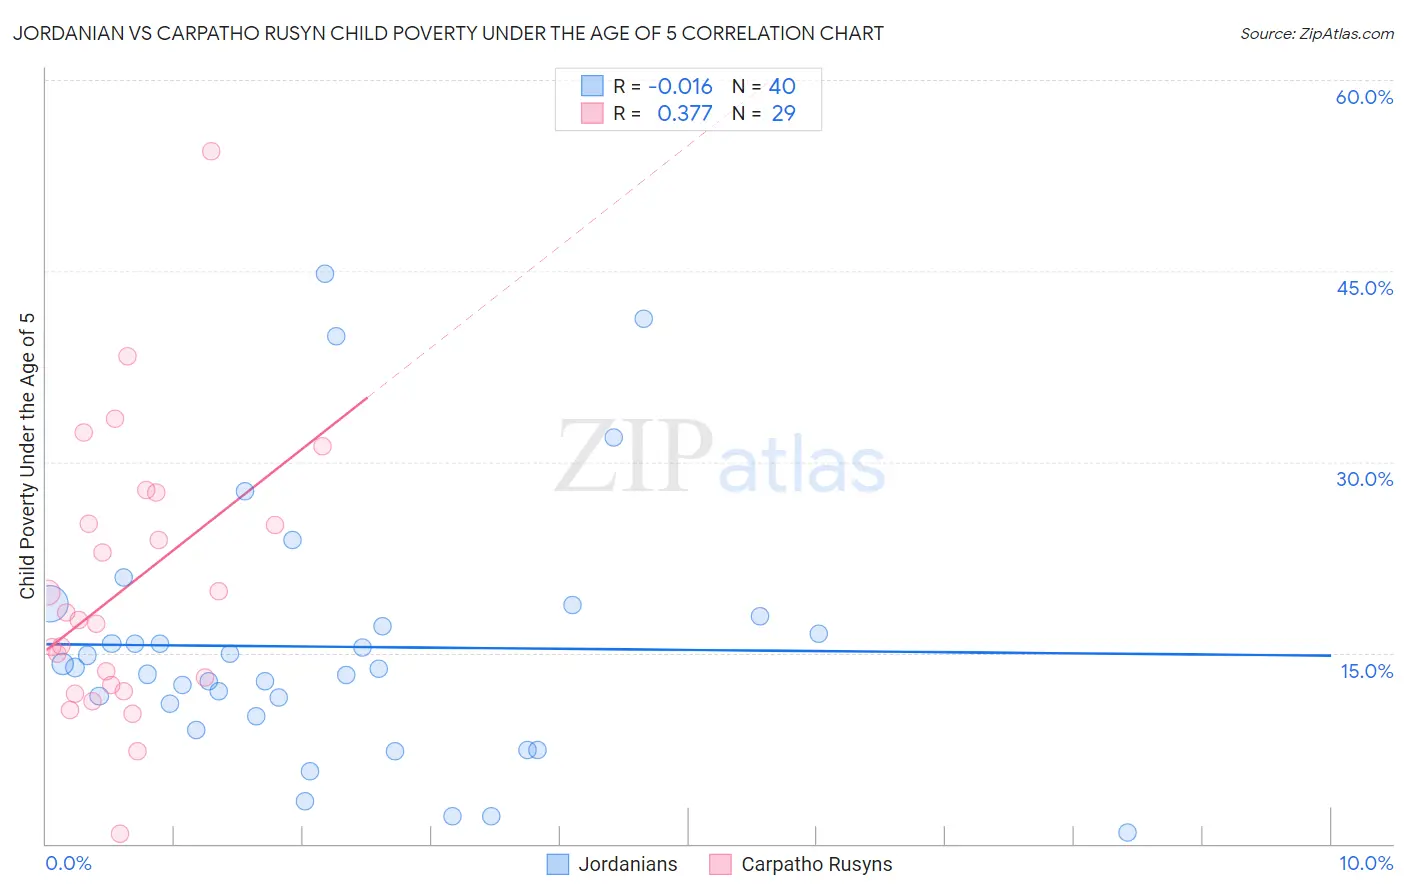
Jordanian vs Carpatho Rusyn Child Poverty Under the Age of 5 Correlation Chart
The statistical analysis conducted on geographies consisting of 163,681,474 people shows no correlation between the proportion of Jordanians and poverty level among children under the age of 5 in the United States with a correlation coefficient (R) of -0.016 and weighted average of 15.6%. Similarly, the statistical analysis conducted on geographies consisting of 57,729,795 people shows a mild positive correlation between the proportion of Carpatho Rusyns and poverty level among children under the age of 5 in the United States with a correlation coefficient (R) of 0.377 and weighted average of 17.5%, a difference of 12.2%.
Child Poverty Under the Age of 5 Correlation Summary
| Measurement | Jordanian | Carpatho Rusyn |
| Minimum | 0.93% | 0.75% |
| Maximum | 44.7% | 54.4% |
| Range | 43.8% | 53.6% |
| Mean | 15.5% | 20.1% |
| Median | 13.8% | 17.6% |
| Interquartile 25% (IQ1) | 10.5% | 12.2% |
| Interquartile 75% (IQ3) | 17.5% | 26.4% |
| Interquartile Range (IQR) | 7.0% | 14.1% |
| Standard Deviation (Sample) | 9.9% | 10.9% |
| Standard Deviation (Population) | 9.8% | 10.7% |
Similar Demographics by Child Poverty Under the Age of 5
Demographics Similar to Jordanians by Child Poverty Under the Age of 5
In terms of child poverty under the age of 5, the demographic groups most similar to Jordanians are Immigrants from Vietnam (15.6%, a difference of 0.050%), Immigrants from Croatia (15.6%, a difference of 0.060%), Immigrants from France (15.6%, a difference of 0.060%), Immigrants from Malaysia (15.6%, a difference of 0.13%), and Immigrants from Latvia (15.6%, a difference of 0.14%).
| Demographics | Rating | Rank | Child Poverty Under the Age of 5 |
| Czechs | 97.8 /100 | #81 | Exceptional 15.5% |
| Immigrants | Italy | 97.7 /100 | #82 | Exceptional 15.6% |
| Chileans | 97.6 /100 | #83 | Exceptional 15.6% |
| Immigrants | Netherlands | 97.6 /100 | #84 | Exceptional 15.6% |
| Immigrants | Latvia | 97.4 /100 | #85 | Exceptional 15.6% |
| Immigrants | Malaysia | 97.4 /100 | #86 | Exceptional 15.6% |
| Immigrants | Vietnam | 97.4 /100 | #87 | Exceptional 15.6% |
| Jordanians | 97.3 /100 | #88 | Exceptional 15.6% |
| Immigrants | Croatia | 97.3 /100 | #89 | Exceptional 15.6% |
| Immigrants | France | 97.3 /100 | #90 | Exceptional 15.6% |
| Poles | 97.2 /100 | #91 | Exceptional 15.7% |
| Scandinavians | 97.1 /100 | #92 | Exceptional 15.7% |
| Ukrainians | 97.1 /100 | #93 | Exceptional 15.7% |
| Immigrants | South Eastern Asia | 97.1 /100 | #94 | Exceptional 15.7% |
| Immigrants | Switzerland | 96.4 /100 | #95 | Exceptional 15.8% |
Demographics Similar to Carpatho Rusyns by Child Poverty Under the Age of 5
In terms of child poverty under the age of 5, the demographic groups most similar to Carpatho Rusyns are French (17.5%, a difference of 0.010%), Kenyan (17.5%, a difference of 0.12%), Immigrants from Bosnia and Herzegovina (17.5%, a difference of 0.16%), Immigrants from Armenia (17.5%, a difference of 0.49%), and Slovak (17.6%, a difference of 0.53%).
| Demographics | Rating | Rank | Child Poverty Under the Age of 5 |
| Immigrants | Germany | 41.0 /100 | #181 | Average 17.4% |
| Arabs | 40.7 /100 | #182 | Average 17.4% |
| Lebanese | 40.3 /100 | #183 | Average 17.4% |
| Immigrants | Costa Rica | 39.0 /100 | #184 | Fair 17.4% |
| Immigrants | Armenia | 38.0 /100 | #185 | Fair 17.5% |
| Immigrants | Bosnia and Herzegovina | 35.0 /100 | #186 | Fair 17.5% |
| Kenyans | 34.7 /100 | #187 | Fair 17.5% |
| Carpatho Rusyns | 33.6 /100 | #188 | Fair 17.5% |
| French | 33.6 /100 | #189 | Fair 17.5% |
| Slovaks | 29.2 /100 | #190 | Fair 17.6% |
| Immigrants | Afghanistan | 27.9 /100 | #191 | Fair 17.7% |
| Immigrants | Uruguay | 27.8 /100 | #192 | Fair 17.7% |
| Immigrants | Uganda | 25.0 /100 | #193 | Fair 17.7% |
| French Canadians | 24.6 /100 | #194 | Fair 17.7% |
| Sierra Leoneans | 24.1 /100 | #195 | Fair 17.7% |