Trinidadian and Tobagonian vs Carpatho Rusyn Child Poverty Under the Age of 5
COMPARE
Trinidadian and Tobagonian
Carpatho Rusyn
Child Poverty Under the Age of 5
Child Poverty Under the Age of 5 Comparison
Trinidadians and Tobagonians
Carpatho Rusyns
19.3%
CHILD POVERTY UNDER THE AGE OF 5
0.9/ 100
METRIC RATING
232nd/ 347
METRIC RANK
17.5%
CHILD POVERTY UNDER THE AGE OF 5
33.6/ 100
METRIC RATING
188th/ 347
METRIC RANK
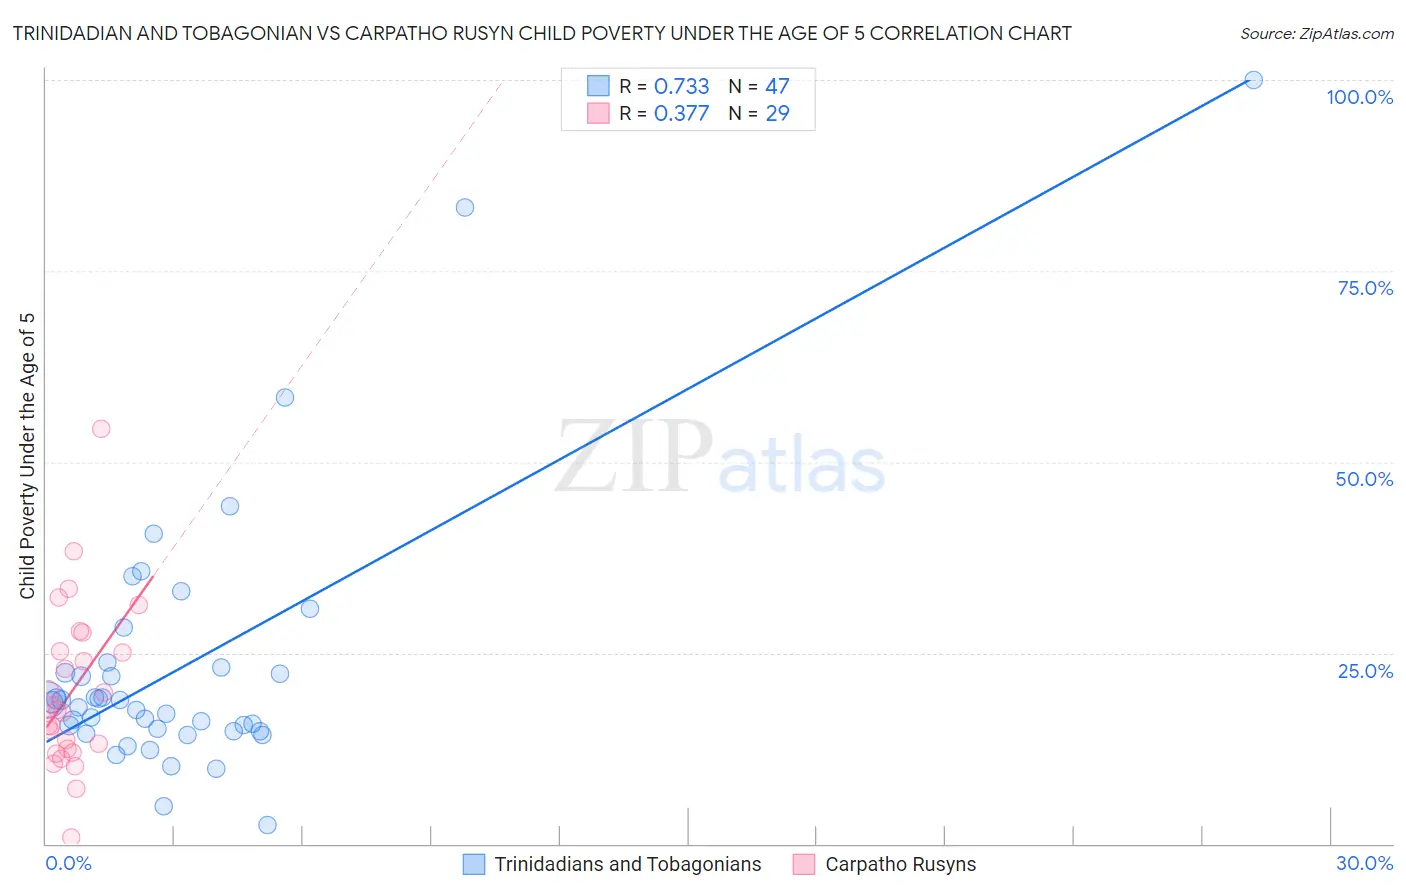
Trinidadian and Tobagonian vs Carpatho Rusyn Child Poverty Under the Age of 5 Correlation Chart
The statistical analysis conducted on geographies consisting of 214,796,578 people shows a strong positive correlation between the proportion of Trinidadians and Tobagonians and poverty level among children under the age of 5 in the United States with a correlation coefficient (R) of 0.733 and weighted average of 19.3%. Similarly, the statistical analysis conducted on geographies consisting of 57,729,795 people shows a mild positive correlation between the proportion of Carpatho Rusyns and poverty level among children under the age of 5 in the United States with a correlation coefficient (R) of 0.377 and weighted average of 17.5%, a difference of 10.2%.
Child Poverty Under the Age of 5 Correlation Summary
| Measurement | Trinidadian and Tobagonian | Carpatho Rusyn |
| Minimum | 2.5% | 0.75% |
| Maximum | 100.0% | 54.4% |
| Range | 97.5% | 53.6% |
| Mean | 23.2% | 20.1% |
| Median | 18.5% | 17.6% |
| Interquartile 25% (IQ1) | 14.8% | 12.2% |
| Interquartile 75% (IQ3) | 23.0% | 26.4% |
| Interquartile Range (IQR) | 8.2% | 14.1% |
| Standard Deviation (Sample) | 17.8% | 10.9% |
| Standard Deviation (Population) | 17.6% | 10.7% |
Similar Demographics by Child Poverty Under the Age of 5
Demographics Similar to Trinidadians and Tobagonians by Child Poverty Under the Age of 5
In terms of child poverty under the age of 5, the demographic groups most similar to Trinidadians and Tobagonians are Sudanese (19.3%, a difference of 0.060%), Immigrants from Micronesia (19.4%, a difference of 0.18%), Immigrants from Laos (19.4%, a difference of 0.39%), Immigrants from Trinidad and Tobago (19.4%, a difference of 0.39%), and Bermudan (19.2%, a difference of 0.56%).
| Demographics | Rating | Rank | Child Poverty Under the Age of 5 |
| Nigerians | 1.6 /100 | #225 | Tragic 19.1% |
| Immigrants | Eritrea | 1.5 /100 | #226 | Tragic 19.1% |
| Cape Verdeans | 1.4 /100 | #227 | Tragic 19.1% |
| Immigrants | Sudan | 1.3 /100 | #228 | Tragic 19.2% |
| Ghanaians | 1.2 /100 | #229 | Tragic 19.2% |
| Ecuadorians | 1.2 /100 | #230 | Tragic 19.2% |
| Bermudans | 1.2 /100 | #231 | Tragic 19.2% |
| Trinidadians and Tobagonians | 0.9 /100 | #232 | Tragic 19.3% |
| Sudanese | 0.9 /100 | #233 | Tragic 19.3% |
| Immigrants | Micronesia | 0.9 /100 | #234 | Tragic 19.4% |
| Immigrants | Laos | 0.8 /100 | #235 | Tragic 19.4% |
| Immigrants | Trinidad and Tobago | 0.8 /100 | #236 | Tragic 19.4% |
| Immigrants | Cabo Verde | 0.6 /100 | #237 | Tragic 19.5% |
| Salvadorans | 0.6 /100 | #238 | Tragic 19.5% |
| Vietnamese | 0.6 /100 | #239 | Tragic 19.5% |
Demographics Similar to Carpatho Rusyns by Child Poverty Under the Age of 5
In terms of child poverty under the age of 5, the demographic groups most similar to Carpatho Rusyns are French (17.5%, a difference of 0.010%), Kenyan (17.5%, a difference of 0.12%), Immigrants from Bosnia and Herzegovina (17.5%, a difference of 0.16%), Immigrants from Armenia (17.5%, a difference of 0.49%), and Slovak (17.6%, a difference of 0.53%).
| Demographics | Rating | Rank | Child Poverty Under the Age of 5 |
| Immigrants | Germany | 41.0 /100 | #181 | Average 17.4% |
| Arabs | 40.7 /100 | #182 | Average 17.4% |
| Lebanese | 40.3 /100 | #183 | Average 17.4% |
| Immigrants | Costa Rica | 39.0 /100 | #184 | Fair 17.4% |
| Immigrants | Armenia | 38.0 /100 | #185 | Fair 17.5% |
| Immigrants | Bosnia and Herzegovina | 35.0 /100 | #186 | Fair 17.5% |
| Kenyans | 34.7 /100 | #187 | Fair 17.5% |
| Carpatho Rusyns | 33.6 /100 | #188 | Fair 17.5% |
| French | 33.6 /100 | #189 | Fair 17.5% |
| Slovaks | 29.2 /100 | #190 | Fair 17.6% |
| Immigrants | Afghanistan | 27.9 /100 | #191 | Fair 17.7% |
| Immigrants | Uruguay | 27.8 /100 | #192 | Fair 17.7% |
| Immigrants | Uganda | 25.0 /100 | #193 | Fair 17.7% |
| French Canadians | 24.6 /100 | #194 | Fair 17.7% |
| Sierra Leoneans | 24.1 /100 | #195 | Fair 17.7% |