Immigrants from Guyana vs Guamanian/Chamorro Child Poverty Under the Age of 5
COMPARE
Immigrants from Guyana
Guamanian/Chamorro
Child Poverty Under the Age of 5
Child Poverty Under the Age of 5 Comparison
Immigrants from Guyana
Guamanians/Chamorros
19.6%
CHILD POVERTY UNDER THE AGE OF 5
0.5/ 100
METRIC RATING
242nd/ 347
METRIC RANK
16.5%
CHILD POVERTY UNDER THE AGE OF 5
84.2/ 100
METRIC RATING
140th/ 347
METRIC RANK
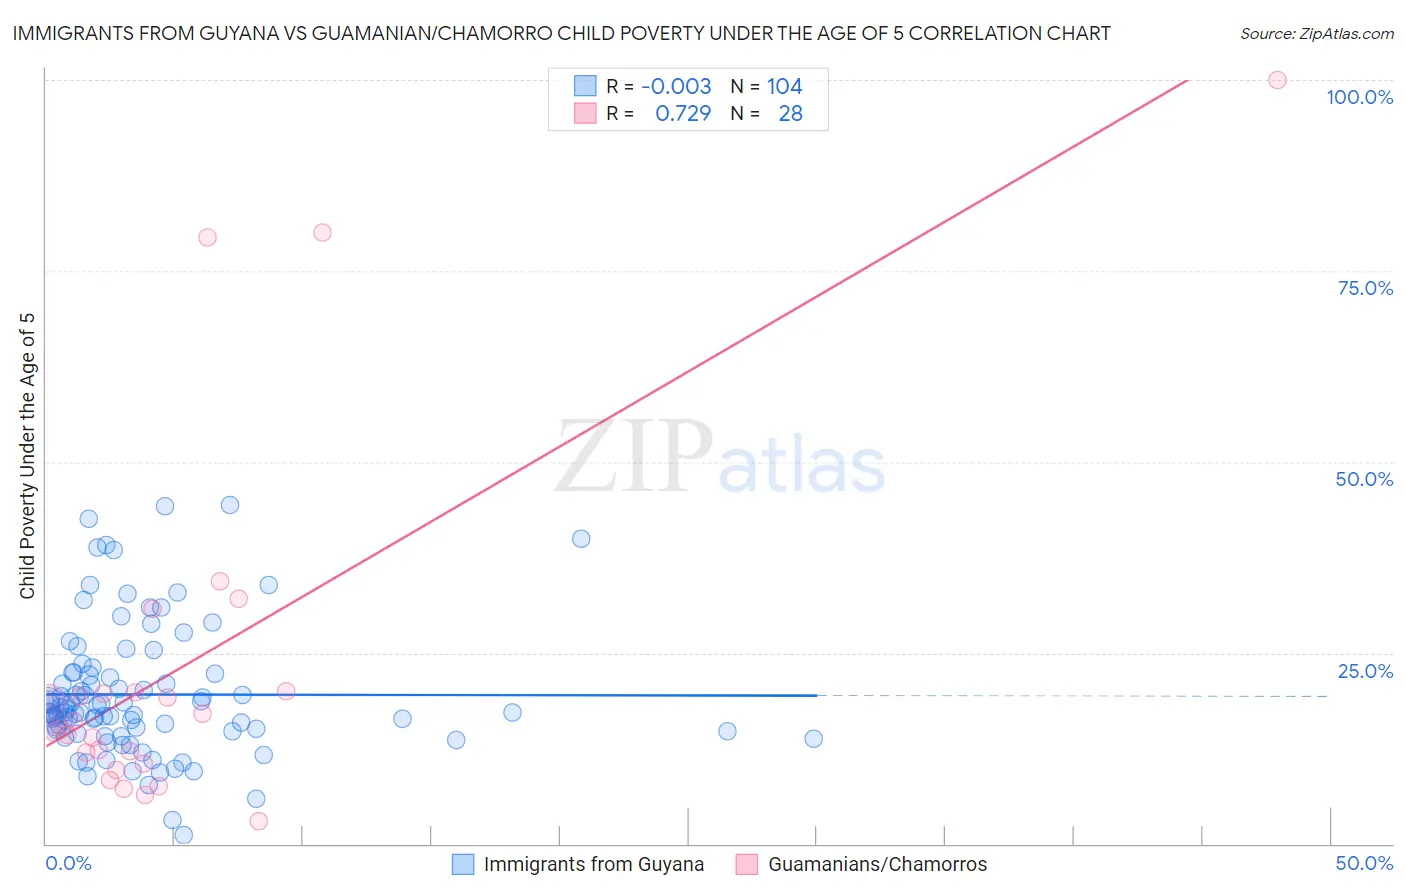
Immigrants from Guyana vs Guamanian/Chamorro Child Poverty Under the Age of 5 Correlation Chart
The statistical analysis conducted on geographies consisting of 179,217,429 people shows no correlation between the proportion of Immigrants from Guyana and poverty level among children under the age of 5 in the United States with a correlation coefficient (R) of -0.003 and weighted average of 19.6%. Similarly, the statistical analysis conducted on geographies consisting of 218,115,058 people shows a strong positive correlation between the proportion of Guamanians/Chamorros and poverty level among children under the age of 5 in the United States with a correlation coefficient (R) of 0.729 and weighted average of 16.5%, a difference of 19.0%.
Child Poverty Under the Age of 5 Correlation Summary
| Measurement | Immigrants from Guyana | Guamanian/Chamorro |
| Minimum | 1.1% | 3.0% |
| Maximum | 44.4% | 100.0% |
| Range | 43.2% | 97.0% |
| Mean | 19.5% | 23.3% |
| Median | 17.2% | 15.5% |
| Interquartile 25% (IQ1) | 14.7% | 11.2% |
| Interquartile 75% (IQ3) | 22.3% | 19.9% |
| Interquartile Range (IQR) | 7.6% | 8.6% |
| Standard Deviation (Sample) | 8.6% | 23.7% |
| Standard Deviation (Population) | 8.6% | 23.3% |
Similar Demographics by Child Poverty Under the Age of 5
Demographics Similar to Immigrants from Guyana by Child Poverty Under the Age of 5
In terms of child poverty under the age of 5, the demographic groups most similar to Immigrants from Guyana are Osage (19.6%, a difference of 0.10%), Alaska Native (19.6%, a difference of 0.11%), Immigrants from Ghana (19.6%, a difference of 0.12%), Immigrants from Ecuador (19.6%, a difference of 0.18%), and Immigrants from Western Africa (19.7%, a difference of 0.31%).
| Demographics | Rating | Rank | Child Poverty Under the Age of 5 |
| Immigrants | Laos | 0.8 /100 | #235 | Tragic 19.4% |
| Immigrants | Trinidad and Tobago | 0.8 /100 | #236 | Tragic 19.4% |
| Immigrants | Cabo Verde | 0.6 /100 | #237 | Tragic 19.5% |
| Salvadorans | 0.6 /100 | #238 | Tragic 19.5% |
| Vietnamese | 0.6 /100 | #239 | Tragic 19.5% |
| Immigrants | Ecuador | 0.5 /100 | #240 | Tragic 19.6% |
| Alaska Natives | 0.5 /100 | #241 | Tragic 19.6% |
| Immigrants | Guyana | 0.5 /100 | #242 | Tragic 19.6% |
| Osage | 0.5 /100 | #243 | Tragic 19.6% |
| Immigrants | Ghana | 0.5 /100 | #244 | Tragic 19.6% |
| Immigrants | Western Africa | 0.4 /100 | #245 | Tragic 19.7% |
| Cree | 0.4 /100 | #246 | Tragic 19.7% |
| Guyanese | 0.4 /100 | #247 | Tragic 19.7% |
| Marshallese | 0.4 /100 | #248 | Tragic 19.7% |
| Immigrants | Middle Africa | 0.4 /100 | #249 | Tragic 19.7% |
Demographics Similar to Guamanians/Chamorros by Child Poverty Under the Age of 5
In terms of child poverty under the age of 5, the demographic groups most similar to Guamanians/Chamorros are Immigrants from Hungary (16.5%, a difference of 0.070%), German (16.5%, a difference of 0.13%), Immigrants from Western Europe (16.5%, a difference of 0.19%), Immigrants from Chile (16.4%, a difference of 0.23%), and Portuguese (16.5%, a difference of 0.23%).
| Demographics | Rating | Rank | Child Poverty Under the Age of 5 |
| Icelanders | 87.9 /100 | #133 | Excellent 16.3% |
| Immigrants | North Macedonia | 87.8 /100 | #134 | Excellent 16.4% |
| Brazilians | 87.8 /100 | #135 | Excellent 16.4% |
| Immigrants | Northern Africa | 87.5 /100 | #136 | Excellent 16.4% |
| Immigrants | Chile | 85.3 /100 | #137 | Excellent 16.4% |
| Germans | 84.8 /100 | #138 | Excellent 16.5% |
| Immigrants | Hungary | 84.5 /100 | #139 | Excellent 16.5% |
| Guamanians/Chamorros | 84.2 /100 | #140 | Excellent 16.5% |
| Immigrants | Western Europe | 83.3 /100 | #141 | Excellent 16.5% |
| Portuguese | 83.0 /100 | #142 | Excellent 16.5% |
| Samoans | 83.0 /100 | #143 | Excellent 16.5% |
| Ethiopians | 82.7 /100 | #144 | Excellent 16.5% |
| Immigrants | Ethiopia | 82.1 /100 | #145 | Excellent 16.6% |
| Israelis | 82.0 /100 | #146 | Excellent 16.6% |
| Immigrants | Nepal | 80.3 /100 | #147 | Excellent 16.6% |