Immigrants from St. Vincent and the Grenadines vs Carpatho Rusyn Child Poverty Under the Age of 5
COMPARE
Immigrants from St. Vincent and the Grenadines
Carpatho Rusyn
Child Poverty Under the Age of 5
Child Poverty Under the Age of 5 Comparison
Immigrants from St. Vincent and the Grenadines
Carpatho Rusyns
20.0%
CHILD POVERTY UNDER THE AGE OF 5
0.2/ 100
METRIC RATING
258th/ 347
METRIC RANK
17.5%
CHILD POVERTY UNDER THE AGE OF 5
33.6/ 100
METRIC RATING
188th/ 347
METRIC RANK
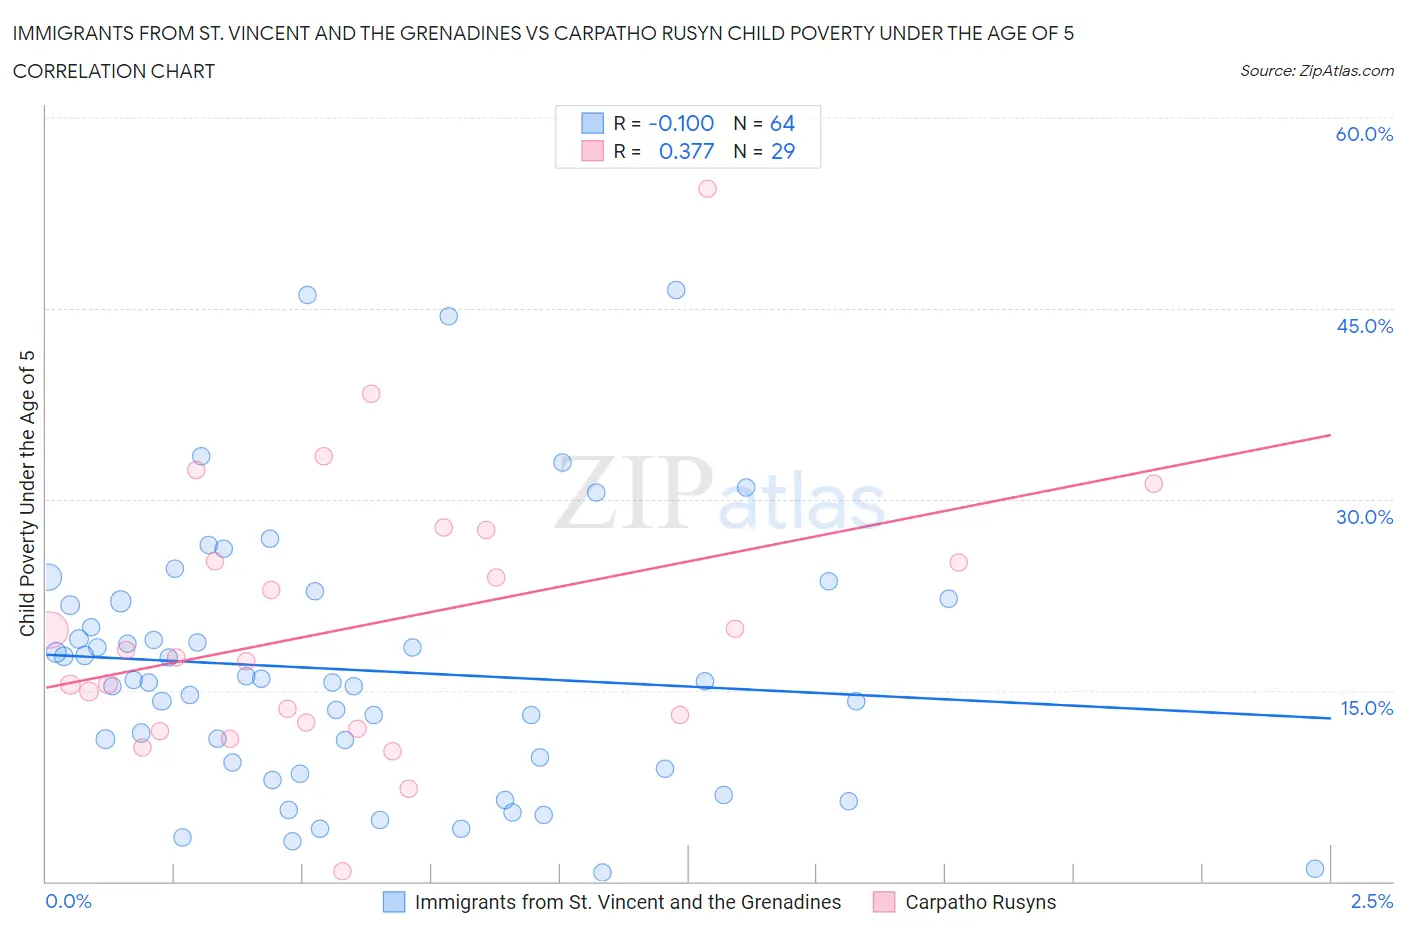
Immigrants from St. Vincent and the Grenadines vs Carpatho Rusyn Child Poverty Under the Age of 5 Correlation Chart
The statistical analysis conducted on geographies consisting of 55,885,863 people shows a slight negative correlation between the proportion of Immigrants from St. Vincent and the Grenadines and poverty level among children under the age of 5 in the United States with a correlation coefficient (R) of -0.100 and weighted average of 20.0%. Similarly, the statistical analysis conducted on geographies consisting of 57,729,795 people shows a mild positive correlation between the proportion of Carpatho Rusyns and poverty level among children under the age of 5 in the United States with a correlation coefficient (R) of 0.377 and weighted average of 17.5%, a difference of 14.0%.
Child Poverty Under the Age of 5 Correlation Summary
| Measurement | Immigrants from St. Vincent and the Grenadines | Carpatho Rusyn |
| Minimum | 0.65% | 0.75% |
| Maximum | 46.4% | 54.4% |
| Range | 45.8% | 53.6% |
| Mean | 16.6% | 20.1% |
| Median | 15.7% | 17.6% |
| Interquartile 25% (IQ1) | 9.1% | 12.2% |
| Interquartile 75% (IQ3) | 21.9% | 26.4% |
| Interquartile Range (IQR) | 12.8% | 14.1% |
| Standard Deviation (Sample) | 10.2% | 10.9% |
| Standard Deviation (Population) | 10.1% | 10.7% |
Similar Demographics by Child Poverty Under the Age of 5
Demographics Similar to Immigrants from St. Vincent and the Grenadines by Child Poverty Under the Age of 5
In terms of child poverty under the age of 5, the demographic groups most similar to Immigrants from St. Vincent and the Grenadines are Immigrants from El Salvador (20.0%, a difference of 0.030%), Shoshone (20.0%, a difference of 0.14%), Immigrants from Barbados (20.0%, a difference of 0.15%), Immigrants from Cuba (19.9%, a difference of 0.37%), and Spanish American (20.1%, a difference of 0.43%).
| Demographics | Rating | Rank | Child Poverty Under the Age of 5 |
| Pennsylvania Germans | 0.3 /100 | #251 | Tragic 19.8% |
| Immigrants | Nicaragua | 0.3 /100 | #252 | Tragic 19.8% |
| Mexican American Indians | 0.3 /100 | #253 | Tragic 19.9% |
| Fijians | 0.3 /100 | #254 | Tragic 19.9% |
| Immigrants | Cuba | 0.2 /100 | #255 | Tragic 19.9% |
| Immigrants | Barbados | 0.2 /100 | #256 | Tragic 20.0% |
| Shoshone | 0.2 /100 | #257 | Tragic 20.0% |
| Immigrants | St. Vincent and the Grenadines | 0.2 /100 | #258 | Tragic 20.0% |
| Immigrants | El Salvador | 0.2 /100 | #259 | Tragic 20.0% |
| Spanish Americans | 0.2 /100 | #260 | Tragic 20.1% |
| Immigrants | Bangladesh | 0.2 /100 | #261 | Tragic 20.1% |
| Liberians | 0.1 /100 | #262 | Tragic 20.2% |
| Barbadians | 0.1 /100 | #263 | Tragic 20.2% |
| Immigrants | Liberia | 0.1 /100 | #264 | Tragic 20.2% |
| Spanish American Indians | 0.1 /100 | #265 | Tragic 20.2% |
Demographics Similar to Carpatho Rusyns by Child Poverty Under the Age of 5
In terms of child poverty under the age of 5, the demographic groups most similar to Carpatho Rusyns are French (17.5%, a difference of 0.010%), Kenyan (17.5%, a difference of 0.12%), Immigrants from Bosnia and Herzegovina (17.5%, a difference of 0.16%), Immigrants from Armenia (17.5%, a difference of 0.49%), and Slovak (17.6%, a difference of 0.53%).
| Demographics | Rating | Rank | Child Poverty Under the Age of 5 |
| Immigrants | Germany | 41.0 /100 | #181 | Average 17.4% |
| Arabs | 40.7 /100 | #182 | Average 17.4% |
| Lebanese | 40.3 /100 | #183 | Average 17.4% |
| Immigrants | Costa Rica | 39.0 /100 | #184 | Fair 17.4% |
| Immigrants | Armenia | 38.0 /100 | #185 | Fair 17.5% |
| Immigrants | Bosnia and Herzegovina | 35.0 /100 | #186 | Fair 17.5% |
| Kenyans | 34.7 /100 | #187 | Fair 17.5% |
| Carpatho Rusyns | 33.6 /100 | #188 | Fair 17.5% |
| French | 33.6 /100 | #189 | Fair 17.5% |
| Slovaks | 29.2 /100 | #190 | Fair 17.6% |
| Immigrants | Afghanistan | 27.9 /100 | #191 | Fair 17.7% |
| Immigrants | Uruguay | 27.8 /100 | #192 | Fair 17.7% |
| Immigrants | Uganda | 25.0 /100 | #193 | Fair 17.7% |
| French Canadians | 24.6 /100 | #194 | Fair 17.7% |
| Sierra Leoneans | 24.1 /100 | #195 | Fair 17.7% |