Immigrants from Guyana vs Immigrants from South Africa Child Poverty Under the Age of 5
COMPARE
Immigrants from Guyana
Immigrants from South Africa
Child Poverty Under the Age of 5
Child Poverty Under the Age of 5 Comparison
Immigrants from Guyana
Immigrants from South Africa
19.6%
CHILD POVERTY UNDER THE AGE OF 5
0.5/ 100
METRIC RATING
242nd/ 347
METRIC RANK
15.8%
CHILD POVERTY UNDER THE AGE OF 5
96.1/ 100
METRIC RATING
98th/ 347
METRIC RANK
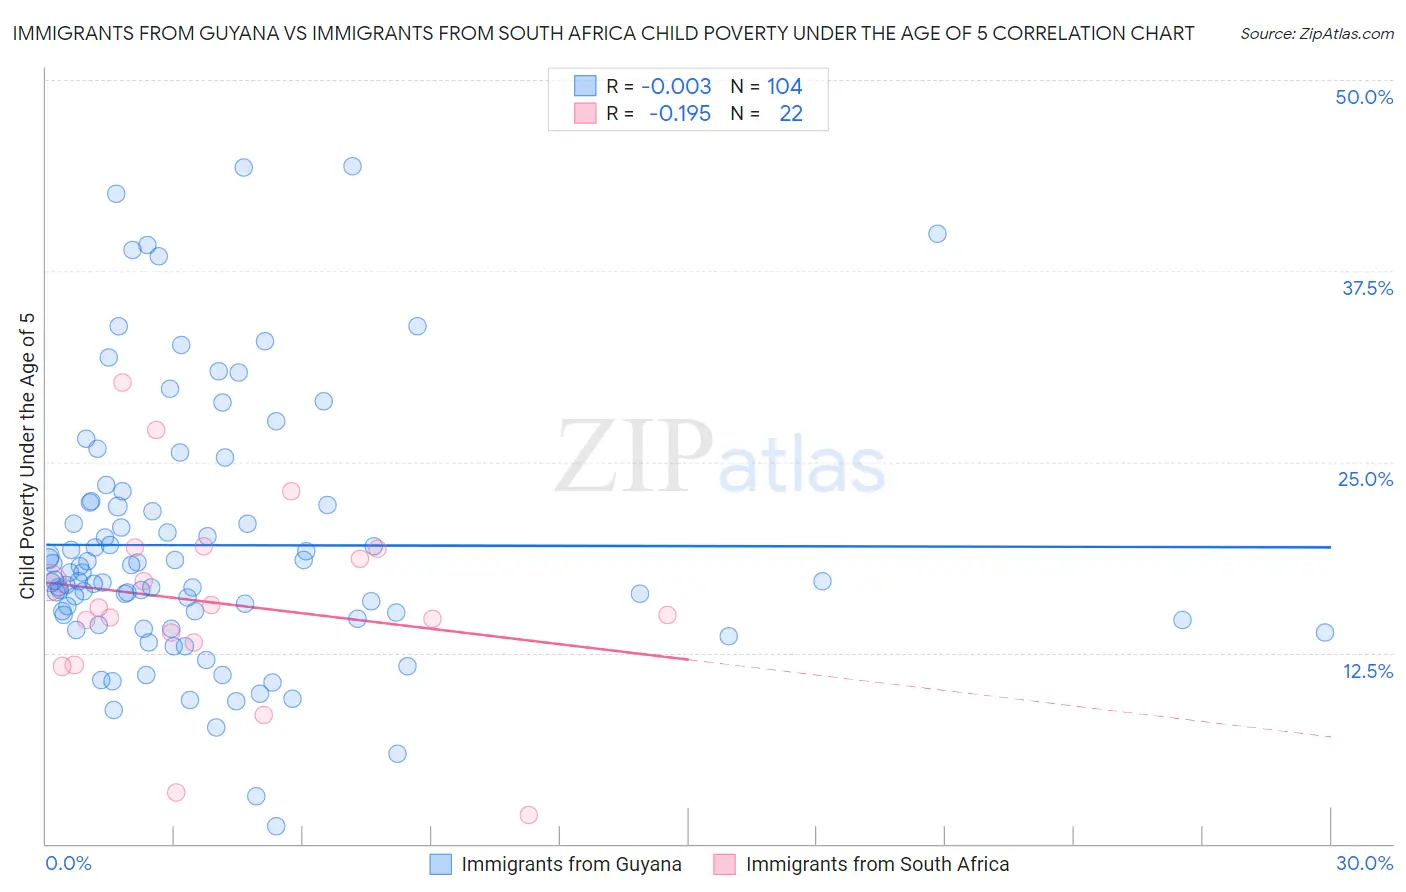
Immigrants from Guyana vs Immigrants from South Africa Child Poverty Under the Age of 5 Correlation Chart
The statistical analysis conducted on geographies consisting of 179,217,429 people shows no correlation between the proportion of Immigrants from Guyana and poverty level among children under the age of 5 in the United States with a correlation coefficient (R) of -0.003 and weighted average of 19.6%. Similarly, the statistical analysis conducted on geographies consisting of 224,707,543 people shows a poor negative correlation between the proportion of Immigrants from South Africa and poverty level among children under the age of 5 in the United States with a correlation coefficient (R) of -0.195 and weighted average of 15.8%, a difference of 24.1%.
Child Poverty Under the Age of 5 Correlation Summary
| Measurement | Immigrants from Guyana | Immigrants from South Africa |
| Minimum | 1.1% | 1.9% |
| Maximum | 44.4% | 30.2% |
| Range | 43.2% | 28.3% |
| Mean | 19.5% | 15.7% |
| Median | 17.2% | 15.2% |
| Interquartile 25% (IQ1) | 14.7% | 13.2% |
| Interquartile 75% (IQ3) | 22.3% | 19.3% |
| Interquartile Range (IQR) | 7.6% | 6.1% |
| Standard Deviation (Sample) | 8.6% | 6.5% |
| Standard Deviation (Population) | 8.6% | 6.4% |
Similar Demographics by Child Poverty Under the Age of 5
Demographics Similar to Immigrants from Guyana by Child Poverty Under the Age of 5
In terms of child poverty under the age of 5, the demographic groups most similar to Immigrants from Guyana are Osage (19.6%, a difference of 0.10%), Alaska Native (19.6%, a difference of 0.11%), Immigrants from Ghana (19.6%, a difference of 0.12%), Immigrants from Ecuador (19.6%, a difference of 0.18%), and Immigrants from Western Africa (19.7%, a difference of 0.31%).
| Demographics | Rating | Rank | Child Poverty Under the Age of 5 |
| Immigrants | Laos | 0.8 /100 | #235 | Tragic 19.4% |
| Immigrants | Trinidad and Tobago | 0.8 /100 | #236 | Tragic 19.4% |
| Immigrants | Cabo Verde | 0.6 /100 | #237 | Tragic 19.5% |
| Salvadorans | 0.6 /100 | #238 | Tragic 19.5% |
| Vietnamese | 0.6 /100 | #239 | Tragic 19.5% |
| Immigrants | Ecuador | 0.5 /100 | #240 | Tragic 19.6% |
| Alaska Natives | 0.5 /100 | #241 | Tragic 19.6% |
| Immigrants | Guyana | 0.5 /100 | #242 | Tragic 19.6% |
| Osage | 0.5 /100 | #243 | Tragic 19.6% |
| Immigrants | Ghana | 0.5 /100 | #244 | Tragic 19.6% |
| Immigrants | Western Africa | 0.4 /100 | #245 | Tragic 19.7% |
| Cree | 0.4 /100 | #246 | Tragic 19.7% |
| Guyanese | 0.4 /100 | #247 | Tragic 19.7% |
| Marshallese | 0.4 /100 | #248 | Tragic 19.7% |
| Immigrants | Middle Africa | 0.4 /100 | #249 | Tragic 19.7% |
Demographics Similar to Immigrants from South Africa by Child Poverty Under the Age of 5
In terms of child poverty under the age of 5, the demographic groups most similar to Immigrants from South Africa are Macedonian (15.8%, a difference of 0.070%), Immigrants from Kazakhstan (15.8%, a difference of 0.11%), Palestinian (15.8%, a difference of 0.11%), Immigrants from Canada (15.8%, a difference of 0.13%), and Immigrants from Zimbabwe (15.8%, a difference of 0.13%).
| Demographics | Rating | Rank | Child Poverty Under the Age of 5 |
| Poles | 97.2 /100 | #91 | Exceptional 15.7% |
| Scandinavians | 97.1 /100 | #92 | Exceptional 15.7% |
| Ukrainians | 97.1 /100 | #93 | Exceptional 15.7% |
| Immigrants | South Eastern Asia | 97.1 /100 | #94 | Exceptional 15.7% |
| Immigrants | Switzerland | 96.4 /100 | #95 | Exceptional 15.8% |
| Immigrants | Kazakhstan | 96.2 /100 | #96 | Exceptional 15.8% |
| Macedonians | 96.2 /100 | #97 | Exceptional 15.8% |
| Immigrants | South Africa | 96.1 /100 | #98 | Exceptional 15.8% |
| Palestinians | 95.9 /100 | #99 | Exceptional 15.8% |
| Immigrants | Canada | 95.9 /100 | #100 | Exceptional 15.8% |
| Immigrants | Zimbabwe | 95.9 /100 | #101 | Exceptional 15.8% |
| Armenians | 95.7 /100 | #102 | Exceptional 15.8% |
| Europeans | 95.3 /100 | #103 | Exceptional 15.9% |
| Immigrants | North America | 94.9 /100 | #104 | Exceptional 15.9% |
| Immigrants | Spain | 94.8 /100 | #105 | Exceptional 15.9% |