Immigrants from Sweden vs Carpatho Rusyn Child Poverty Under the Age of 5
COMPARE
Immigrants from Sweden
Carpatho Rusyn
Child Poverty Under the Age of 5
Child Poverty Under the Age of 5 Comparison
Immigrants from Sweden
Carpatho Rusyns
15.3%
CHILD POVERTY UNDER THE AGE OF 5
98.8/ 100
METRIC RATING
72nd/ 347
METRIC RANK
17.5%
CHILD POVERTY UNDER THE AGE OF 5
33.6/ 100
METRIC RATING
188th/ 347
METRIC RANK
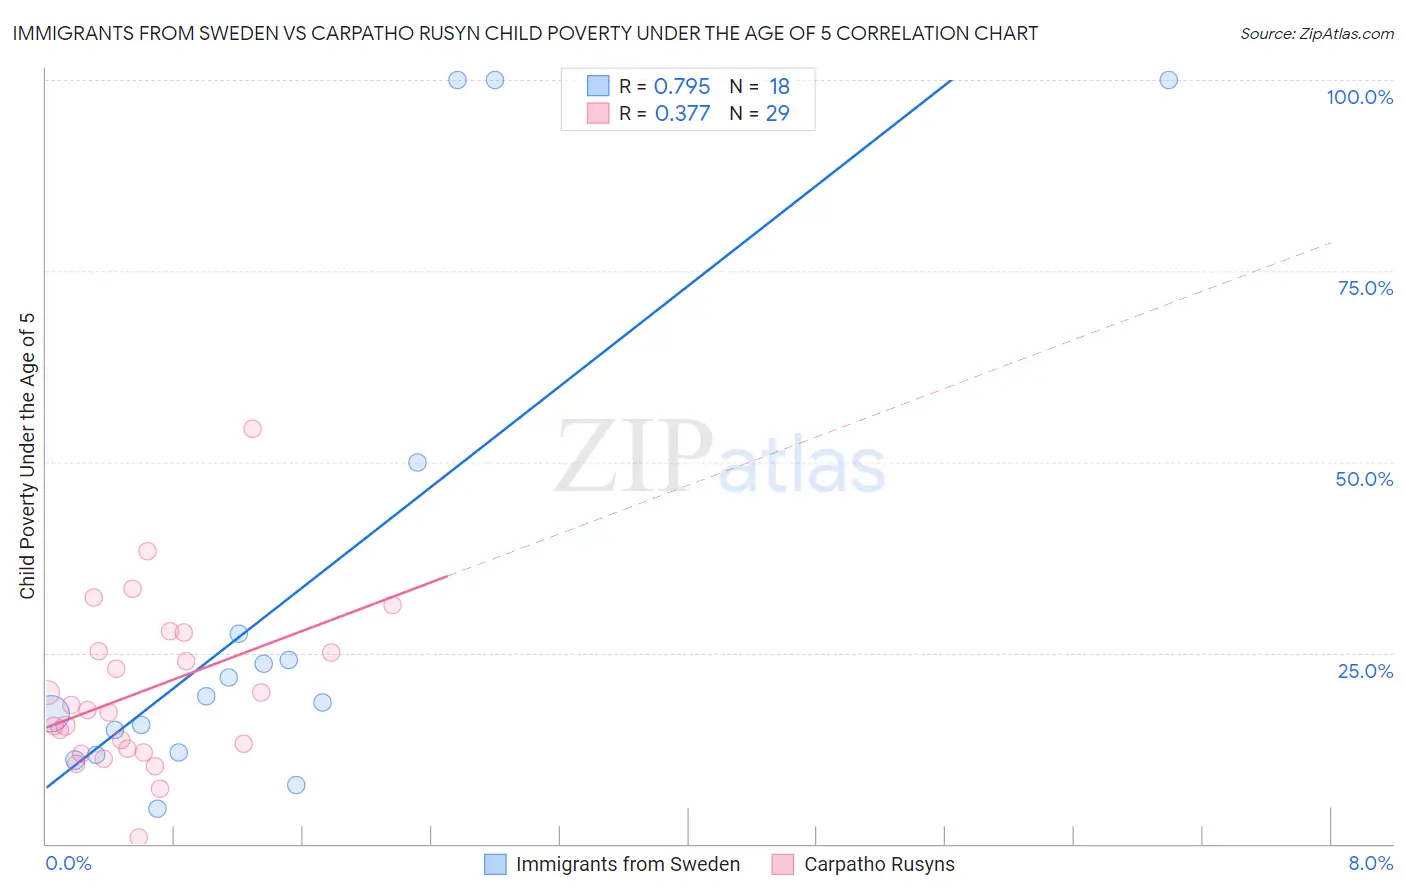
Immigrants from Sweden vs Carpatho Rusyn Child Poverty Under the Age of 5 Correlation Chart
The statistical analysis conducted on geographies consisting of 159,371,189 people shows a strong positive correlation between the proportion of Immigrants from Sweden and poverty level among children under the age of 5 in the United States with a correlation coefficient (R) of 0.795 and weighted average of 15.3%. Similarly, the statistical analysis conducted on geographies consisting of 57,729,795 people shows a mild positive correlation between the proportion of Carpatho Rusyns and poverty level among children under the age of 5 in the United States with a correlation coefficient (R) of 0.377 and weighted average of 17.5%, a difference of 14.9%.
Child Poverty Under the Age of 5 Correlation Summary
| Measurement | Immigrants from Sweden | Carpatho Rusyn |
| Minimum | 4.7% | 0.75% |
| Maximum | 100.0% | 54.4% |
| Range | 95.3% | 53.6% |
| Mean | 32.2% | 20.1% |
| Median | 18.9% | 17.6% |
| Interquartile 25% (IQ1) | 12.0% | 12.2% |
| Interquartile 75% (IQ3) | 27.5% | 26.4% |
| Interquartile Range (IQR) | 15.4% | 14.1% |
| Standard Deviation (Sample) | 32.7% | 10.9% |
| Standard Deviation (Population) | 31.8% | 10.7% |
Similar Demographics by Child Poverty Under the Age of 5
Demographics Similar to Immigrants from Sweden by Child Poverty Under the Age of 5
In terms of child poverty under the age of 5, the demographic groups most similar to Immigrants from Sweden are Immigrants from Belgium (15.3%, a difference of 0.070%), Immigrants from Egypt (15.3%, a difference of 0.070%), Immigrants from Ukraine (15.3%, a difference of 0.23%), Lithuanian (15.2%, a difference of 0.50%), and Greek (15.2%, a difference of 0.52%).
| Demographics | Rating | Rank | Child Poverty Under the Age of 5 |
| Immigrants | Fiji | 99.0 /100 | #65 | Exceptional 15.2% |
| Immigrants | Scotland | 99.0 /100 | #66 | Exceptional 15.2% |
| Greeks | 99.0 /100 | #67 | Exceptional 15.2% |
| Zimbabweans | 99.0 /100 | #68 | Exceptional 15.2% |
| Lithuanians | 99.0 /100 | #69 | Exceptional 15.2% |
| Immigrants | Belgium | 98.8 /100 | #70 | Exceptional 15.3% |
| Immigrants | Egypt | 98.8 /100 | #71 | Exceptional 15.3% |
| Immigrants | Sweden | 98.8 /100 | #72 | Exceptional 15.3% |
| Immigrants | Ukraine | 98.7 /100 | #73 | Exceptional 15.3% |
| Argentineans | 98.5 /100 | #74 | Exceptional 15.4% |
| Immigrants | Argentina | 98.5 /100 | #75 | Exceptional 15.4% |
| Croatians | 98.5 /100 | #76 | Exceptional 15.4% |
| Immigrants | Turkey | 98.3 /100 | #77 | Exceptional 15.4% |
| Sri Lankans | 98.1 /100 | #78 | Exceptional 15.5% |
| Australians | 98.0 /100 | #79 | Exceptional 15.5% |
Demographics Similar to Carpatho Rusyns by Child Poverty Under the Age of 5
In terms of child poverty under the age of 5, the demographic groups most similar to Carpatho Rusyns are French (17.5%, a difference of 0.010%), Kenyan (17.5%, a difference of 0.12%), Immigrants from Bosnia and Herzegovina (17.5%, a difference of 0.16%), Immigrants from Armenia (17.5%, a difference of 0.49%), and Slovak (17.6%, a difference of 0.53%).
| Demographics | Rating | Rank | Child Poverty Under the Age of 5 |
| Immigrants | Germany | 41.0 /100 | #181 | Average 17.4% |
| Arabs | 40.7 /100 | #182 | Average 17.4% |
| Lebanese | 40.3 /100 | #183 | Average 17.4% |
| Immigrants | Costa Rica | 39.0 /100 | #184 | Fair 17.4% |
| Immigrants | Armenia | 38.0 /100 | #185 | Fair 17.5% |
| Immigrants | Bosnia and Herzegovina | 35.0 /100 | #186 | Fair 17.5% |
| Kenyans | 34.7 /100 | #187 | Fair 17.5% |
| Carpatho Rusyns | 33.6 /100 | #188 | Fair 17.5% |
| French | 33.6 /100 | #189 | Fair 17.5% |
| Slovaks | 29.2 /100 | #190 | Fair 17.6% |
| Immigrants | Afghanistan | 27.9 /100 | #191 | Fair 17.7% |
| Immigrants | Uruguay | 27.8 /100 | #192 | Fair 17.7% |
| Immigrants | Uganda | 25.0 /100 | #193 | Fair 17.7% |
| French Canadians | 24.6 /100 | #194 | Fair 17.7% |
| Sierra Leoneans | 24.1 /100 | #195 | Fair 17.7% |