Immigrants from Guyana vs Bulgarian Hearing Disability
COMPARE
Immigrants from Guyana
Bulgarian
Hearing Disability
Hearing Disability Comparison
Immigrants from Guyana
Bulgarians
2.3%
HEARING DISABILITY
100.0/ 100
METRIC RATING
4th/ 347
METRIC RANK
3.0%
HEARING DISABILITY
39.7/ 100
METRIC RATING
183rd/ 347
METRIC RANK
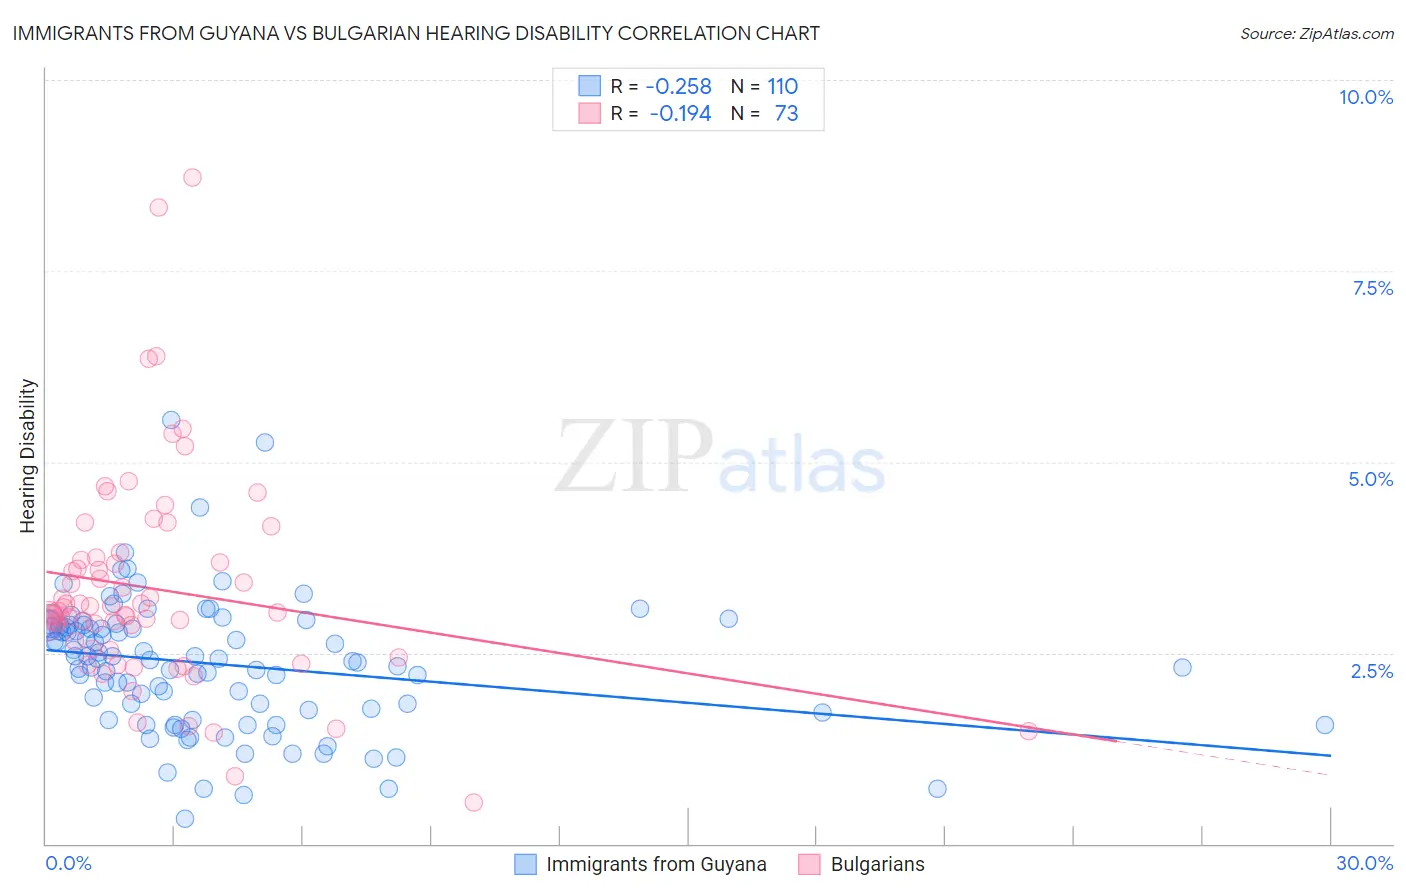
Immigrants from Guyana vs Bulgarian Hearing Disability Correlation Chart
The statistical analysis conducted on geographies consisting of 183,657,050 people shows a weak negative correlation between the proportion of Immigrants from Guyana and percentage of population with hearing disability in the United States with a correlation coefficient (R) of -0.258 and weighted average of 2.3%. Similarly, the statistical analysis conducted on geographies consisting of 205,610,417 people shows a poor negative correlation between the proportion of Bulgarians and percentage of population with hearing disability in the United States with a correlation coefficient (R) of -0.194 and weighted average of 3.0%, a difference of 30.4%.
Hearing Disability Correlation Summary
| Measurement | Immigrants from Guyana | Bulgarian |
| Minimum | 0.33% | 0.54% |
| Maximum | 5.6% | 8.7% |
| Range | 5.2% | 8.2% |
| Mean | 2.4% | 3.3% |
| Median | 2.4% | 3.1% |
| Interquartile 25% (IQ1) | 1.8% | 2.5% |
| Interquartile 75% (IQ3) | 2.9% | 3.7% |
| Interquartile Range (IQR) | 1.1% | 1.2% |
| Standard Deviation (Sample) | 0.87% | 1.4% |
| Standard Deviation (Population) | 0.86% | 1.4% |
Similar Demographics by Hearing Disability
Demographics Similar to Immigrants from Guyana by Hearing Disability
In terms of hearing disability, the demographic groups most similar to Immigrants from Guyana are Guyanese (2.3%, a difference of 1.4%), Immigrants from Barbados (2.4%, a difference of 1.9%), Immigrants from St. Vincent and the Grenadines (2.3%, a difference of 2.8%), Vietnamese (2.4%, a difference of 3.0%), and Immigrants from Bangladesh (2.4%, a difference of 4.6%).
| Demographics | Rating | Rank | Hearing Disability |
| Immigrants | Grenada | 100.0 /100 | #1 | Exceptional 2.2% |
| Immigrants | St. Vincent and the Grenadines | 100.0 /100 | #2 | Exceptional 2.3% |
| Guyanese | 100.0 /100 | #3 | Exceptional 2.3% |
| Immigrants | Guyana | 100.0 /100 | #4 | Exceptional 2.3% |
| Immigrants | Barbados | 100.0 /100 | #5 | Exceptional 2.4% |
| Vietnamese | 100.0 /100 | #6 | Exceptional 2.4% |
| Immigrants | Bangladesh | 100.0 /100 | #7 | Exceptional 2.4% |
| British West Indians | 100.0 /100 | #8 | Exceptional 2.4% |
| Immigrants | Dominican Republic | 100.0 /100 | #9 | Exceptional 2.4% |
| Immigrants | Ecuador | 99.9 /100 | #10 | Exceptional 2.5% |
| Immigrants | Trinidad and Tobago | 99.9 /100 | #11 | Exceptional 2.5% |
| Trinidadians and Tobagonians | 99.9 /100 | #12 | Exceptional 2.5% |
| Sierra Leoneans | 99.9 /100 | #13 | Exceptional 2.5% |
| Ecuadorians | 99.9 /100 | #14 | Exceptional 2.5% |
| Barbadians | 99.9 /100 | #15 | Exceptional 2.5% |
Demographics Similar to Bulgarians by Hearing Disability
In terms of hearing disability, the demographic groups most similar to Bulgarians are Immigrants from Italy (3.0%, a difference of 0.14%), Immigrants from Belgium (3.0%, a difference of 0.17%), Immigrants from Ireland (3.0%, a difference of 0.23%), Immigrants from Sweden (3.0%, a difference of 0.26%), and Immigrants from Moldova (3.0%, a difference of 0.32%).
| Demographics | Rating | Rank | Hearing Disability |
| Panamanians | 47.0 /100 | #176 | Average 3.0% |
| Immigrants | Philippines | 46.4 /100 | #177 | Average 3.0% |
| Japanese | 46.0 /100 | #178 | Average 3.0% |
| Immigrants | Moldova | 43.1 /100 | #179 | Average 3.0% |
| Immigrants | Sweden | 42.4 /100 | #180 | Average 3.0% |
| Immigrants | Belgium | 41.5 /100 | #181 | Average 3.0% |
| Immigrants | Italy | 41.1 /100 | #182 | Average 3.0% |
| Bulgarians | 39.7 /100 | #183 | Fair 3.0% |
| Immigrants | Ireland | 37.4 /100 | #184 | Fair 3.0% |
| Immigrants | Southern Europe | 35.3 /100 | #185 | Fair 3.0% |
| Immigrants | Mexico | 34.9 /100 | #186 | Fair 3.0% |
| Blacks/African Americans | 34.7 /100 | #187 | Fair 3.0% |
| Mexican American Indians | 34.7 /100 | #188 | Fair 3.0% |
| Africans | 32.9 /100 | #189 | Fair 3.0% |
| Immigrants | South Africa | 31.1 /100 | #190 | Fair 3.1% |