Barbadian vs Bulgarian Poverty
COMPARE
Barbadian
Bulgarian
Poverty
Poverty Comparison
Barbadians
Bulgarians
14.8%
POVERTY
0.0/ 100
METRIC RATING
274th/ 347
METRIC RANK
10.2%
POVERTY
99.9/ 100
METRIC RATING
10th/ 347
METRIC RANK
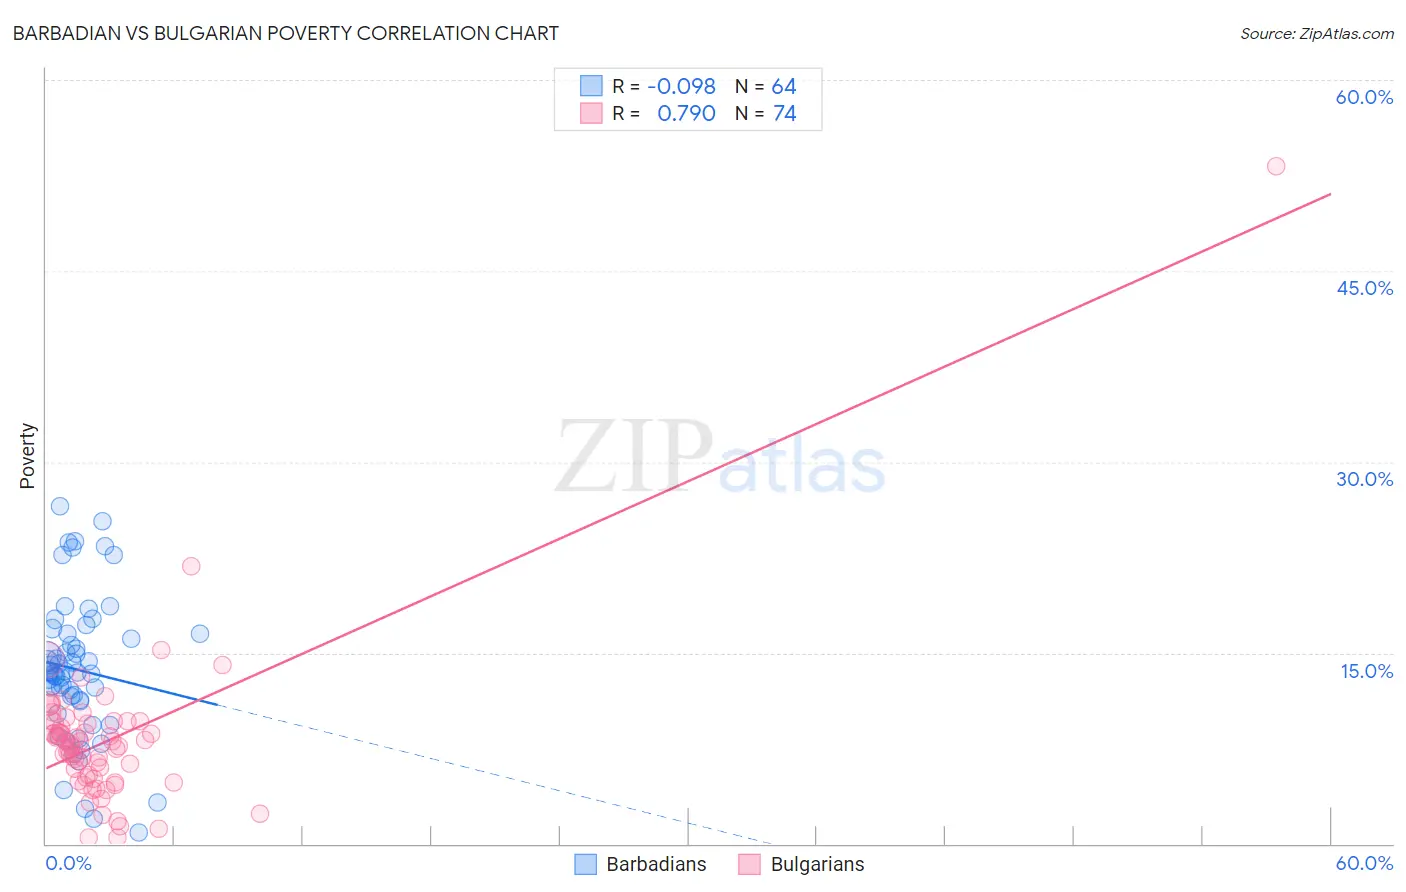
Barbadian vs Bulgarian Poverty Correlation Chart
The statistical analysis conducted on geographies consisting of 141,278,644 people shows a slight negative correlation between the proportion of Barbadians and poverty level in the United States with a correlation coefficient (R) of -0.098 and weighted average of 14.8%. Similarly, the statistical analysis conducted on geographies consisting of 205,564,290 people shows a strong positive correlation between the proportion of Bulgarians and poverty level in the United States with a correlation coefficient (R) of 0.790 and weighted average of 10.2%, a difference of 44.5%.
Poverty Correlation Summary
| Measurement | Barbadian | Bulgarian |
| Minimum | 0.88% | 0.47% |
| Maximum | 26.5% | 53.2% |
| Range | 25.6% | 52.7% |
| Mean | 13.7% | 8.2% |
| Median | 13.5% | 7.8% |
| Interquartile 25% (IQ1) | 11.2% | 5.2% |
| Interquartile 75% (IQ3) | 16.5% | 9.5% |
| Interquartile Range (IQR) | 5.3% | 4.3% |
| Standard Deviation (Sample) | 5.6% | 6.4% |
| Standard Deviation (Population) | 5.6% | 6.3% |
Similar Demographics by Poverty
Demographics Similar to Barbadians by Poverty
In terms of poverty, the demographic groups most similar to Barbadians are Immigrants from West Indies (14.8%, a difference of 0.040%), Immigrants from Bahamas (14.8%, a difference of 0.040%), Bangladeshi (14.8%, a difference of 0.090%), Belizean (14.8%, a difference of 0.11%), and Spanish American (14.7%, a difference of 0.39%).
| Demographics | Rating | Rank | Poverty |
| Iroquois | 0.1 /100 | #267 | Tragic 14.5% |
| Sub-Saharan Africans | 0.1 /100 | #268 | Tragic 14.5% |
| Immigrants | Cuba | 0.1 /100 | #269 | Tragic 14.6% |
| Central Americans | 0.1 /100 | #270 | Tragic 14.6% |
| Shoshone | 0.0 /100 | #271 | Tragic 14.7% |
| Chickasaw | 0.0 /100 | #272 | Tragic 14.7% |
| Spanish Americans | 0.0 /100 | #273 | Tragic 14.7% |
| Barbadians | 0.0 /100 | #274 | Tragic 14.8% |
| Immigrants | West Indies | 0.0 /100 | #275 | Tragic 14.8% |
| Immigrants | Bahamas | 0.0 /100 | #276 | Tragic 14.8% |
| Bangladeshis | 0.0 /100 | #277 | Tragic 14.8% |
| Belizeans | 0.0 /100 | #278 | Tragic 14.8% |
| Immigrants | St. Vincent and the Grenadines | 0.0 /100 | #279 | Tragic 14.9% |
| Haitians | 0.0 /100 | #280 | Tragic 14.9% |
| Immigrants | Barbados | 0.0 /100 | #281 | Tragic 14.9% |
Demographics Similar to Bulgarians by Poverty
In terms of poverty, the demographic groups most similar to Bulgarians are Immigrants from South Central Asia (10.2%, a difference of 0.41%), Maltese (10.2%, a difference of 0.86%), Immigrants from Lithuania (10.3%, a difference of 0.99%), Filipino (10.1%, a difference of 1.3%), and Bhutanese (10.4%, a difference of 1.3%).
| Demographics | Rating | Rank | Poverty |
| Thais | 100.0 /100 | #3 | Exceptional 9.6% |
| Immigrants | Taiwan | 100.0 /100 | #4 | Exceptional 9.7% |
| Immigrants | Ireland | 99.9 /100 | #5 | Exceptional 10.1% |
| Assyrians/Chaldeans/Syriacs | 99.9 /100 | #6 | Exceptional 10.1% |
| Filipinos | 99.9 /100 | #7 | Exceptional 10.1% |
| Maltese | 99.9 /100 | #8 | Exceptional 10.2% |
| Immigrants | South Central Asia | 99.9 /100 | #9 | Exceptional 10.2% |
| Bulgarians | 99.9 /100 | #10 | Exceptional 10.2% |
| Immigrants | Lithuania | 99.9 /100 | #11 | Exceptional 10.3% |
| Bhutanese | 99.8 /100 | #12 | Exceptional 10.4% |
| Immigrants | Hong Kong | 99.8 /100 | #13 | Exceptional 10.4% |
| Immigrants | Bolivia | 99.8 /100 | #14 | Exceptional 10.4% |
| Bolivians | 99.8 /100 | #15 | Exceptional 10.4% |
| Lithuanians | 99.8 /100 | #16 | Exceptional 10.5% |
| Norwegians | 99.8 /100 | #17 | Exceptional 10.5% |