Immigrants from Greece vs Belgian Family Households
COMPARE
Immigrants from Greece
Belgian
Family Households
Family Households Comparison
Immigrants from Greece
Belgians
63.5%
FAMILY HOUSEHOLDS
2.9/ 100
METRIC RATING
231st/ 347
METRIC RANK
63.8%
FAMILY HOUSEHOLDS
7.6/ 100
METRIC RATING
215th/ 347
METRIC RANK
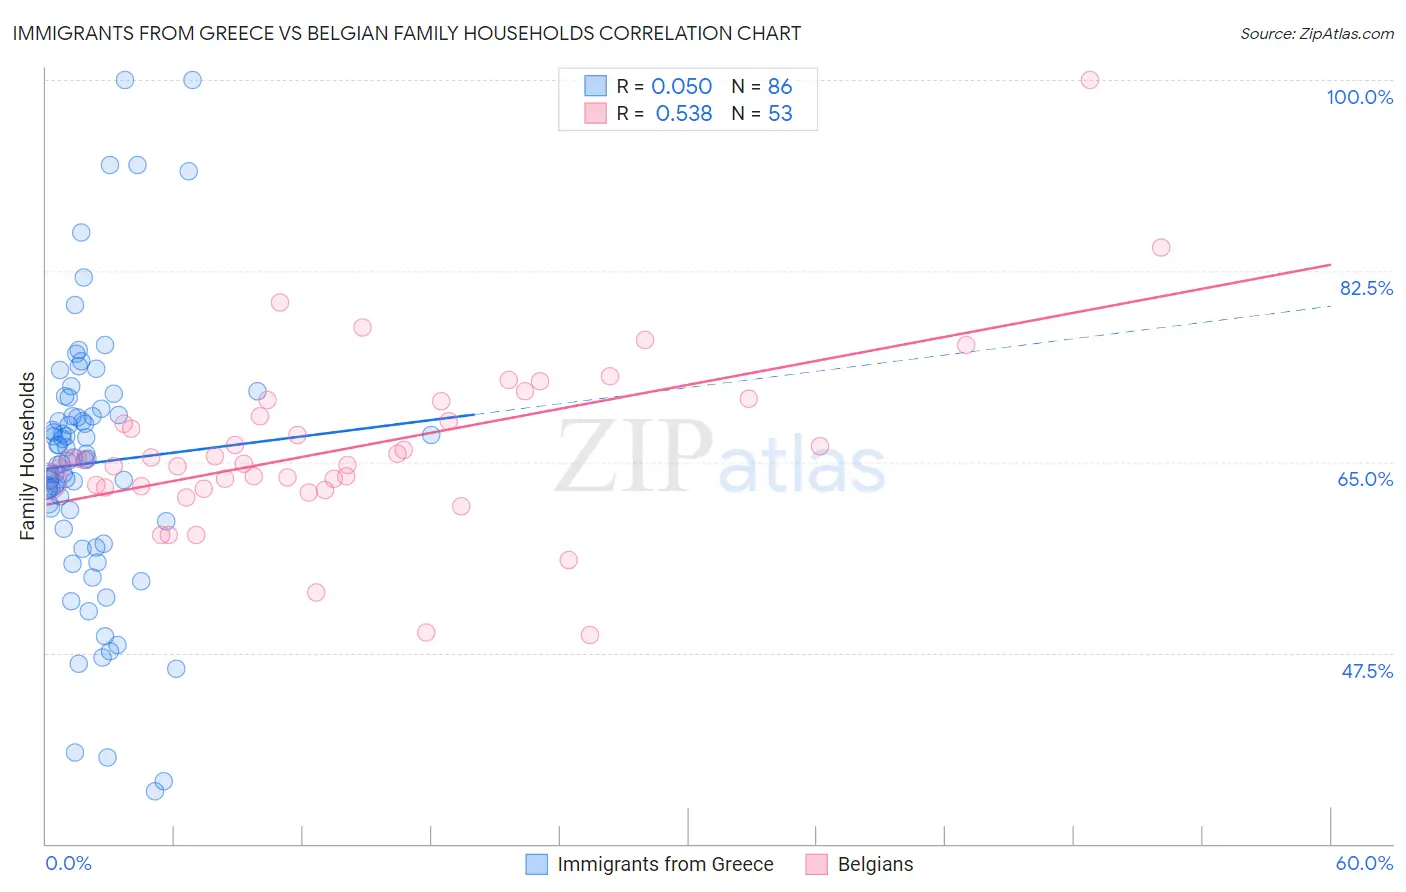
Immigrants from Greece vs Belgian Family Households Correlation Chart
The statistical analysis conducted on geographies consisting of 216,856,850 people shows no correlation between the proportion of Immigrants from Greece and percentage of family households in the United States with a correlation coefficient (R) of 0.050 and weighted average of 63.5%. Similarly, the statistical analysis conducted on geographies consisting of 355,849,592 people shows a substantial positive correlation between the proportion of Belgians and percentage of family households in the United States with a correlation coefficient (R) of 0.538 and weighted average of 63.8%, a difference of 0.34%.
Family Households Correlation Summary
| Measurement | Immigrants from Greece | Belgian |
| Minimum | 34.8% | 49.1% |
| Maximum | 100.0% | 100.0% |
| Range | 65.2% | 50.9% |
| Mean | 64.9% | 66.3% |
| Median | 65.2% | 65.2% |
| Interquartile 25% (IQ1) | 59.6% | 62.7% |
| Interquartile 75% (IQ3) | 69.3% | 69.8% |
| Interquartile Range (IQR) | 9.7% | 7.1% |
| Standard Deviation (Sample) | 12.3% | 8.1% |
| Standard Deviation (Population) | 12.3% | 8.1% |
Demographics Similar to Immigrants from Greece and Belgians by Family Households
In terms of family households, the demographic groups most similar to Immigrants from Greece are Immigrants from Brazil (63.6%, a difference of 0.020%), Immigrants from Northern Africa (63.5%, a difference of 0.030%), Immigrants from Armenia (63.5%, a difference of 0.050%), Bulgarian (63.6%, a difference of 0.060%), and Blackfeet (63.6%, a difference of 0.070%). Similarly, the demographic groups most similar to Belgians are Celtic (63.8%, a difference of 0.020%), Croatian (63.8%, a difference of 0.020%), Osage (63.7%, a difference of 0.030%), Marshallese (63.7%, a difference of 0.030%), and Immigrants from Northern Europe (63.8%, a difference of 0.060%).
| Demographics | Rating | Rank | Family Households |
| Immigrants | Northern Europe | 8.8 /100 | #213 | Tragic 63.8% |
| Celtics | 8.0 /100 | #214 | Tragic 63.8% |
| Belgians | 7.6 /100 | #215 | Tragic 63.8% |
| Croatians | 7.3 /100 | #216 | Tragic 63.8% |
| Osage | 7.0 /100 | #217 | Tragic 63.7% |
| Marshallese | 6.9 /100 | #218 | Tragic 63.7% |
| Macedonians | 6.5 /100 | #219 | Tragic 63.7% |
| Immigrants | Europe | 6.4 /100 | #220 | Tragic 63.7% |
| Immigrants | South Africa | 5.9 /100 | #221 | Tragic 63.7% |
| Immigrants | Belarus | 5.5 /100 | #222 | Tragic 63.7% |
| French Canadians | 5.4 /100 | #223 | Tragic 63.7% |
| Turks | 4.5 /100 | #224 | Tragic 63.6% |
| Immigrants | Hungary | 4.3 /100 | #225 | Tragic 63.6% |
| Immigrants | Bahamas | 4.2 /100 | #226 | Tragic 63.6% |
| Trinidadians and Tobagonians | 4.1 /100 | #227 | Tragic 63.6% |
| Blackfeet | 3.6 /100 | #228 | Tragic 63.6% |
| Bulgarians | 3.4 /100 | #229 | Tragic 63.6% |
| Immigrants | Brazil | 3.0 /100 | #230 | Tragic 63.6% |
| Immigrants | Greece | 2.9 /100 | #231 | Tragic 63.5% |
| Immigrants | Northern Africa | 2.6 /100 | #232 | Tragic 63.5% |
| Immigrants | Armenia | 2.6 /100 | #233 | Tragic 63.5% |