Immigrants from Greece vs Immigrants from Northern Africa Female Poverty
COMPARE
Immigrants from Greece
Immigrants from Northern Africa
Female Poverty
Female Poverty Comparison
Immigrants from Greece
Immigrants from Northern Africa
11.8%
FEMALE POVERTY
99.3/ 100
METRIC RATING
37th/ 347
METRIC RANK
13.2%
FEMALE POVERTY
68.8/ 100
METRIC RATING
157th/ 347
METRIC RANK
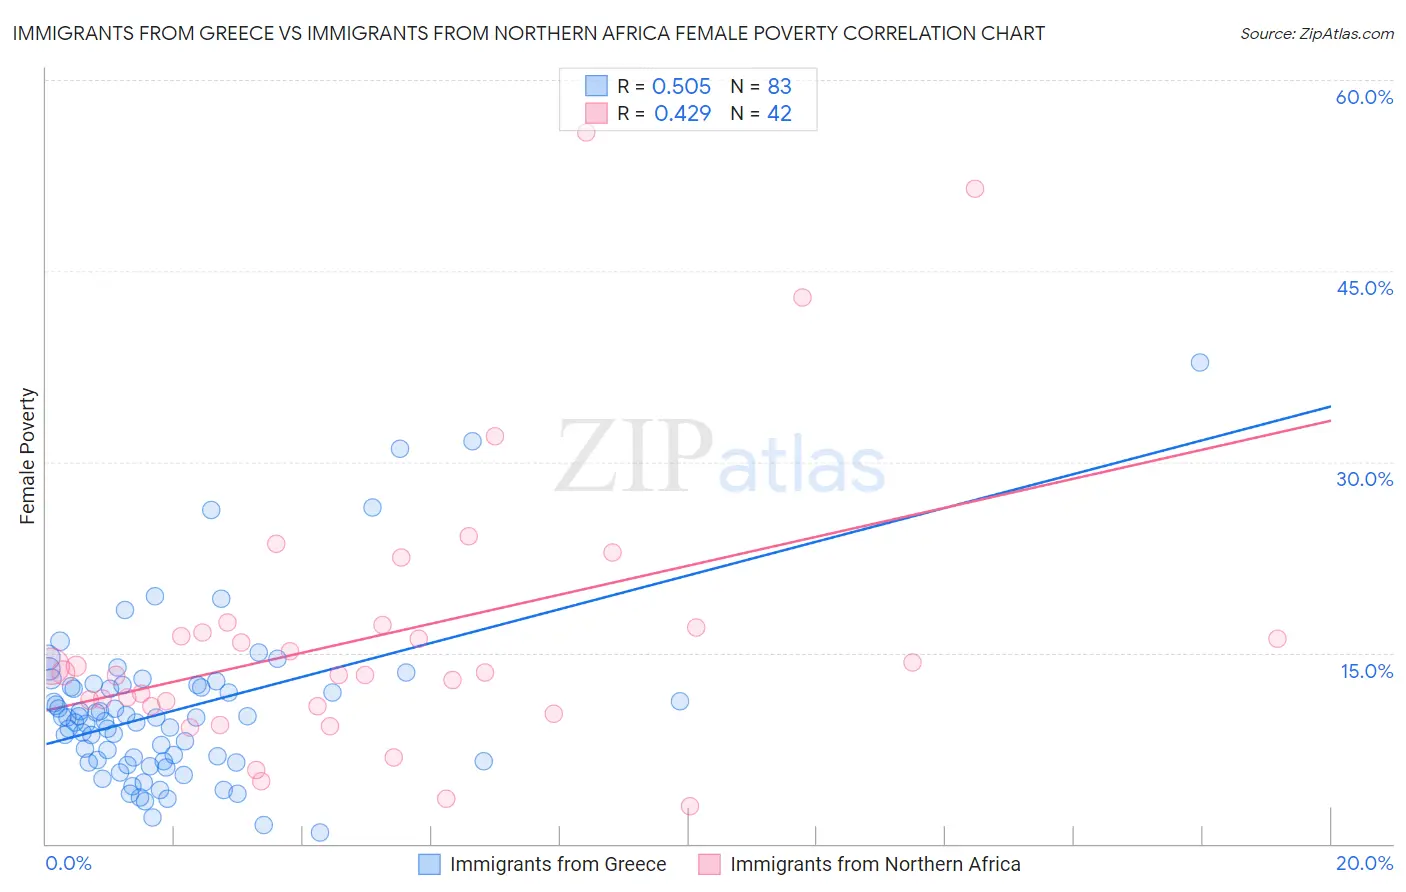
Immigrants from Greece vs Immigrants from Northern Africa Female Poverty Correlation Chart
The statistical analysis conducted on geographies consisting of 216,839,039 people shows a substantial positive correlation between the proportion of Immigrants from Greece and poverty level among females in the United States with a correlation coefficient (R) of 0.505 and weighted average of 11.8%. Similarly, the statistical analysis conducted on geographies consisting of 321,053,699 people shows a moderate positive correlation between the proportion of Immigrants from Northern Africa and poverty level among females in the United States with a correlation coefficient (R) of 0.429 and weighted average of 13.2%, a difference of 11.6%.
Female Poverty Correlation Summary
| Measurement | Immigrants from Greece | Immigrants from Northern Africa |
| Minimum | 0.85% | 3.0% |
| Maximum | 37.8% | 55.9% |
| Range | 37.0% | 52.9% |
| Mean | 10.5% | 16.3% |
| Median | 9.9% | 13.5% |
| Interquartile 25% (IQ1) | 6.5% | 10.8% |
| Interquartile 75% (IQ3) | 12.5% | 17.0% |
| Interquartile Range (IQR) | 6.0% | 6.2% |
| Standard Deviation (Sample) | 6.5% | 11.1% |
| Standard Deviation (Population) | 6.4% | 11.0% |
Similar Demographics by Female Poverty
Demographics Similar to Immigrants from Greece by Female Poverty
In terms of female poverty, the demographic groups most similar to Immigrants from Greece are Russian (11.8%, a difference of 0.020%), Immigrants from Pakistan (11.8%, a difference of 0.10%), Immigrants from Poland (11.8%, a difference of 0.22%), Immigrants from Iran (11.8%, a difference of 0.27%), and Macedonian (11.8%, a difference of 0.27%).
| Demographics | Rating | Rank | Female Poverty |
| Greeks | 99.5 /100 | #30 | Exceptional 11.7% |
| Poles | 99.5 /100 | #31 | Exceptional 11.7% |
| Danes | 99.5 /100 | #32 | Exceptional 11.7% |
| Cypriots | 99.5 /100 | #33 | Exceptional 11.8% |
| Immigrants | Singapore | 99.4 /100 | #34 | Exceptional 11.8% |
| Immigrants | Iran | 99.4 /100 | #35 | Exceptional 11.8% |
| Immigrants | Pakistan | 99.4 /100 | #36 | Exceptional 11.8% |
| Immigrants | Greece | 99.3 /100 | #37 | Exceptional 11.8% |
| Russians | 99.3 /100 | #38 | Exceptional 11.8% |
| Immigrants | Poland | 99.3 /100 | #39 | Exceptional 11.8% |
| Macedonians | 99.3 /100 | #40 | Exceptional 11.8% |
| Czechs | 99.2 /100 | #41 | Exceptional 11.9% |
| Immigrants | Moldova | 99.2 /100 | #42 | Exceptional 11.9% |
| Koreans | 99.2 /100 | #43 | Exceptional 11.9% |
| Tongans | 99.2 /100 | #44 | Exceptional 11.9% |
Demographics Similar to Immigrants from Northern Africa by Female Poverty
In terms of female poverty, the demographic groups most similar to Immigrants from Northern Africa are Immigrants from Bosnia and Herzegovina (13.2%, a difference of 0.10%), Hungarian (13.2%, a difference of 0.15%), Pennsylvania German (13.2%, a difference of 0.17%), Armenian (13.2%, a difference of 0.19%), and Immigrants from Fiji (13.2%, a difference of 0.25%).
| Demographics | Rating | Rank | Female Poverty |
| Tsimshian | 75.5 /100 | #150 | Good 13.1% |
| Immigrants | Germany | 74.9 /100 | #151 | Good 13.1% |
| Samoans | 73.6 /100 | #152 | Good 13.1% |
| Immigrants | Fiji | 71.0 /100 | #153 | Good 13.2% |
| Armenians | 70.4 /100 | #154 | Good 13.2% |
| Hungarians | 70.1 /100 | #155 | Good 13.2% |
| Immigrants | Bosnia and Herzegovina | 69.7 /100 | #156 | Good 13.2% |
| Immigrants | Northern Africa | 68.8 /100 | #157 | Good 13.2% |
| Pennsylvania Germans | 67.3 /100 | #158 | Good 13.2% |
| Costa Ricans | 63.6 /100 | #159 | Good 13.3% |
| Immigrants | Nepal | 62.7 /100 | #160 | Good 13.3% |
| Immigrants | Ethiopia | 62.5 /100 | #161 | Good 13.3% |
| Guamanians/Chamorros | 62.4 /100 | #162 | Good 13.3% |
| Immigrants | Albania | 62.4 /100 | #163 | Good 13.3% |
| Ethiopians | 62.3 /100 | #164 | Good 13.3% |