Immigrants from Greece vs Belgian Single Mother Households
COMPARE
Immigrants from Greece
Belgian
Single Mother Households
Single Mother Households Comparison
Immigrants from Greece
Belgians
5.4%
SINGLE MOTHER HOUSEHOLDS
99.5/ 100
METRIC RATING
41st/ 347
METRIC RANK
5.8%
SINGLE MOTHER HOUSEHOLDS
93.5/ 100
METRIC RATING
122nd/ 347
METRIC RANK
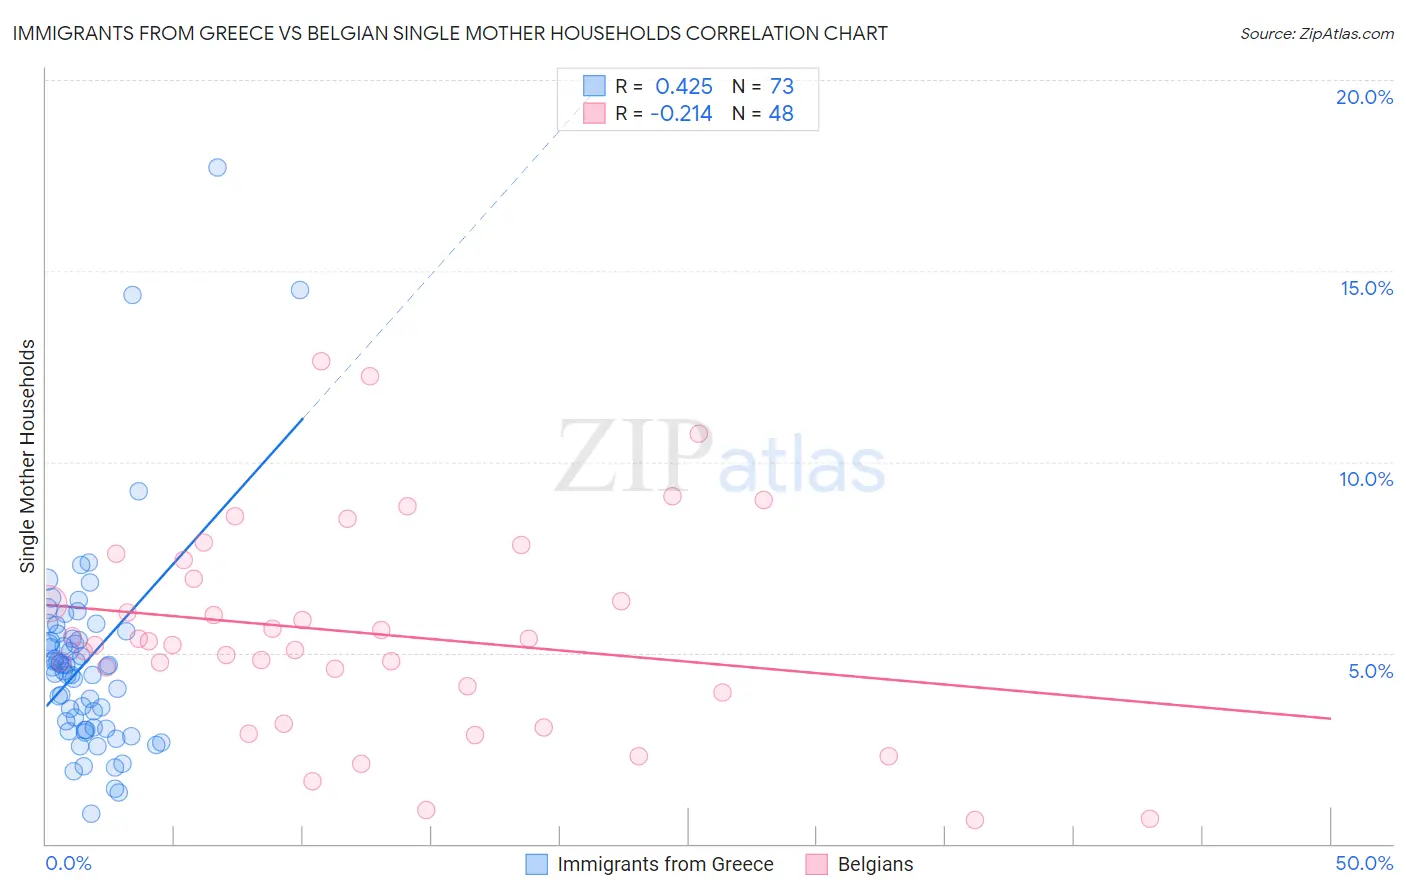
Immigrants from Greece vs Belgian Single Mother Households Correlation Chart
The statistical analysis conducted on geographies consisting of 216,428,324 people shows a moderate positive correlation between the proportion of Immigrants from Greece and percentage of single mother households in the United States with a correlation coefficient (R) of 0.425 and weighted average of 5.4%. Similarly, the statistical analysis conducted on geographies consisting of 354,851,895 people shows a weak negative correlation between the proportion of Belgians and percentage of single mother households in the United States with a correlation coefficient (R) of -0.214 and weighted average of 5.8%, a difference of 8.6%.
Single Mother Households Correlation Summary
| Measurement | Immigrants from Greece | Belgian |
| Minimum | 0.80% | 0.64% |
| Maximum | 17.7% | 12.7% |
| Range | 16.9% | 12.0% |
| Mean | 4.8% | 5.5% |
| Median | 4.7% | 5.3% |
| Interquartile 25% (IQ1) | 3.0% | 4.0% |
| Interquartile 75% (IQ3) | 5.4% | 7.2% |
| Interquartile Range (IQR) | 2.4% | 3.2% |
| Standard Deviation (Sample) | 2.7% | 2.7% |
| Standard Deviation (Population) | 2.7% | 2.7% |
Similar Demographics by Single Mother Households
Demographics Similar to Immigrants from Greece by Single Mother Households
In terms of single mother households, the demographic groups most similar to Immigrants from Greece are Macedonian (5.4%, a difference of 0.080%), Immigrants from South Central Asia (5.4%, a difference of 0.14%), Estonian (5.4%, a difference of 0.42%), Immigrants from Sweden (5.4%, a difference of 0.53%), and Immigrants from Serbia (5.4%, a difference of 0.67%).
| Demographics | Rating | Rank | Single Mother Households |
| Bulgarians | 99.7 /100 | #34 | Exceptional 5.3% |
| Immigrants | Northern Europe | 99.7 /100 | #35 | Exceptional 5.3% |
| Immigrants | Czechoslovakia | 99.7 /100 | #36 | Exceptional 5.3% |
| Immigrants | Belgium | 99.7 /100 | #37 | Exceptional 5.3% |
| Immigrants | Serbia | 99.6 /100 | #38 | Exceptional 5.4% |
| Immigrants | Sweden | 99.6 /100 | #39 | Exceptional 5.4% |
| Estonians | 99.6 /100 | #40 | Exceptional 5.4% |
| Immigrants | Greece | 99.5 /100 | #41 | Exceptional 5.4% |
| Macedonians | 99.5 /100 | #42 | Exceptional 5.4% |
| Immigrants | South Central Asia | 99.5 /100 | #43 | Exceptional 5.4% |
| Lithuanians | 99.4 /100 | #44 | Exceptional 5.4% |
| Immigrants | Croatia | 99.4 /100 | #45 | Exceptional 5.4% |
| Croatians | 99.3 /100 | #46 | Exceptional 5.5% |
| Norwegians | 99.3 /100 | #47 | Exceptional 5.5% |
| Turks | 99.2 /100 | #48 | Exceptional 5.5% |
Demographics Similar to Belgians by Single Mother Households
In terms of single mother households, the demographic groups most similar to Belgians are Immigrants from Uzbekistan (5.9%, a difference of 0.060%), Argentinean (5.8%, a difference of 0.080%), Tongan (5.8%, a difference of 0.10%), Immigrants from Argentina (5.9%, a difference of 0.13%), and Slavic (5.9%, a difference of 0.29%).
| Demographics | Rating | Rank | Single Mother Households |
| Irish | 94.8 /100 | #115 | Exceptional 5.8% |
| Pennsylvania Germans | 94.7 /100 | #116 | Exceptional 5.8% |
| Bolivians | 94.6 /100 | #117 | Exceptional 5.8% |
| Laotians | 94.3 /100 | #118 | Exceptional 5.8% |
| South Africans | 94.1 /100 | #119 | Exceptional 5.8% |
| Tongans | 93.7 /100 | #120 | Exceptional 5.8% |
| Argentineans | 93.7 /100 | #121 | Exceptional 5.8% |
| Belgians | 93.5 /100 | #122 | Exceptional 5.8% |
| Immigrants | Uzbekistan | 93.4 /100 | #123 | Exceptional 5.9% |
| Immigrants | Argentina | 93.2 /100 | #124 | Exceptional 5.9% |
| Slavs | 92.9 /100 | #125 | Exceptional 5.9% |
| Welsh | 92.8 /100 | #126 | Exceptional 5.9% |
| Lebanese | 92.4 /100 | #127 | Exceptional 5.9% |
| Czechoslovakians | 92.2 /100 | #128 | Exceptional 5.9% |
| Immigrants | Bolivia | 92.2 /100 | #129 | Exceptional 5.9% |