Immigrants from El Salvador vs Immigrants from Europe Family Households
COMPARE
Immigrants from El Salvador
Immigrants from Europe
Family Households
Family Households Comparison
Immigrants from El Salvador
Immigrants from Europe
67.0%
FAMILY HOUSEHOLDS
100.0/ 100
METRIC RATING
39th/ 347
METRIC RANK
63.7%
FAMILY HOUSEHOLDS
6.4/ 100
METRIC RATING
220th/ 347
METRIC RANK
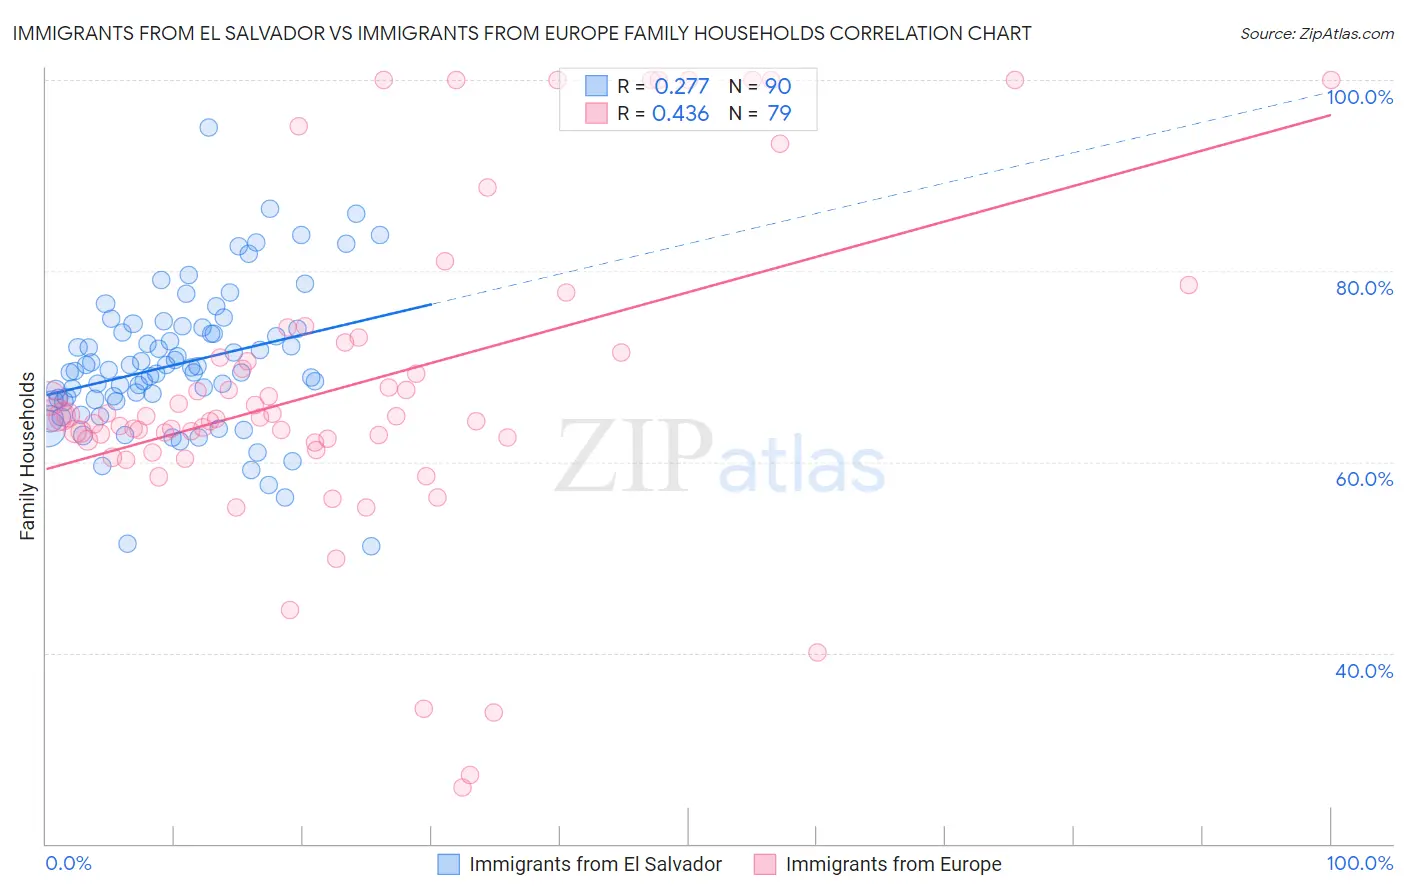
Immigrants from El Salvador vs Immigrants from Europe Family Households Correlation Chart
The statistical analysis conducted on geographies consisting of 357,711,776 people shows a weak positive correlation between the proportion of Immigrants from El Salvador and percentage of family households in the United States with a correlation coefficient (R) of 0.277 and weighted average of 67.0%. Similarly, the statistical analysis conducted on geographies consisting of 546,902,993 people shows a moderate positive correlation between the proportion of Immigrants from Europe and percentage of family households in the United States with a correlation coefficient (R) of 0.436 and weighted average of 63.7%, a difference of 5.1%.
Family Households Correlation Summary
| Measurement | Immigrants from El Salvador | Immigrants from Europe |
| Minimum | 51.1% | 25.9% |
| Maximum | 95.0% | 100.0% |
| Range | 43.8% | 74.1% |
| Mean | 70.2% | 68.1% |
| Median | 69.5% | 64.7% |
| Interquartile 25% (IQ1) | 66.4% | 62.2% |
| Interquartile 75% (IQ3) | 73.9% | 72.5% |
| Interquartile Range (IQR) | 7.5% | 10.2% |
| Standard Deviation (Sample) | 7.5% | 16.6% |
| Standard Deviation (Population) | 7.4% | 16.5% |
Similar Demographics by Family Households
Demographics Similar to Immigrants from El Salvador by Family Households
In terms of family households, the demographic groups most similar to Immigrants from El Salvador are Mexican American Indian (67.0%, a difference of 0.020%), Tsimshian (67.1%, a difference of 0.12%), Peruvian (67.1%, a difference of 0.19%), Tohono O'odham (67.1%, a difference of 0.20%), and Salvadoran (67.2%, a difference of 0.25%).
| Demographics | Rating | Rank | Family Households |
| Nepalese | 100.0 /100 | #32 | Exceptional 67.2% |
| Salvadorans | 100.0 /100 | #33 | Exceptional 67.2% |
| Thais | 100.0 /100 | #34 | Exceptional 67.2% |
| Tohono O'odham | 100.0 /100 | #35 | Exceptional 67.1% |
| Peruvians | 100.0 /100 | #36 | Exceptional 67.1% |
| Tsimshian | 100.0 /100 | #37 | Exceptional 67.1% |
| Mexican American Indians | 100.0 /100 | #38 | Exceptional 67.0% |
| Immigrants | El Salvador | 100.0 /100 | #39 | Exceptional 67.0% |
| Guamanians/Chamorros | 100.0 /100 | #40 | Exceptional 66.6% |
| Immigrants | Bolivia | 100.0 /100 | #41 | Exceptional 66.6% |
| Menominee | 100.0 /100 | #42 | Exceptional 66.5% |
| Apache | 100.0 /100 | #43 | Exceptional 66.5% |
| Asians | 100.0 /100 | #44 | Exceptional 66.5% |
| Venezuelans | 100.0 /100 | #45 | Exceptional 66.5% |
| Arapaho | 100.0 /100 | #46 | Exceptional 66.5% |
Demographics Similar to Immigrants from Europe by Family Households
In terms of family households, the demographic groups most similar to Immigrants from Europe are Macedonian (63.7%, a difference of 0.010%), Immigrants from South Africa (63.7%, a difference of 0.020%), Osage (63.7%, a difference of 0.030%), Marshallese (63.7%, a difference of 0.030%), and Croatian (63.8%, a difference of 0.050%).
| Demographics | Rating | Rank | Family Households |
| Immigrants | Northern Europe | 8.8 /100 | #213 | Tragic 63.8% |
| Celtics | 8.0 /100 | #214 | Tragic 63.8% |
| Belgians | 7.6 /100 | #215 | Tragic 63.8% |
| Croatians | 7.3 /100 | #216 | Tragic 63.8% |
| Osage | 7.0 /100 | #217 | Tragic 63.7% |
| Marshallese | 6.9 /100 | #218 | Tragic 63.7% |
| Macedonians | 6.5 /100 | #219 | Tragic 63.7% |
| Immigrants | Europe | 6.4 /100 | #220 | Tragic 63.7% |
| Immigrants | South Africa | 5.9 /100 | #221 | Tragic 63.7% |
| Immigrants | Belarus | 5.5 /100 | #222 | Tragic 63.7% |
| French Canadians | 5.4 /100 | #223 | Tragic 63.7% |
| Turks | 4.5 /100 | #224 | Tragic 63.6% |
| Immigrants | Hungary | 4.3 /100 | #225 | Tragic 63.6% |
| Immigrants | Bahamas | 4.2 /100 | #226 | Tragic 63.6% |
| Trinidadians and Tobagonians | 4.1 /100 | #227 | Tragic 63.6% |