Immigrants from Sweden vs Thai Female Poverty
COMPARE
Immigrants from Sweden
Thai
Female Poverty
Female Poverty Comparison
Immigrants from Sweden
Thais
12.3%
FEMALE POVERTY
97.1/ 100
METRIC RATING
81st/ 347
METRIC RANK
10.5%
FEMALE POVERTY
100.0/ 100
METRIC RATING
3rd/ 347
METRIC RANK
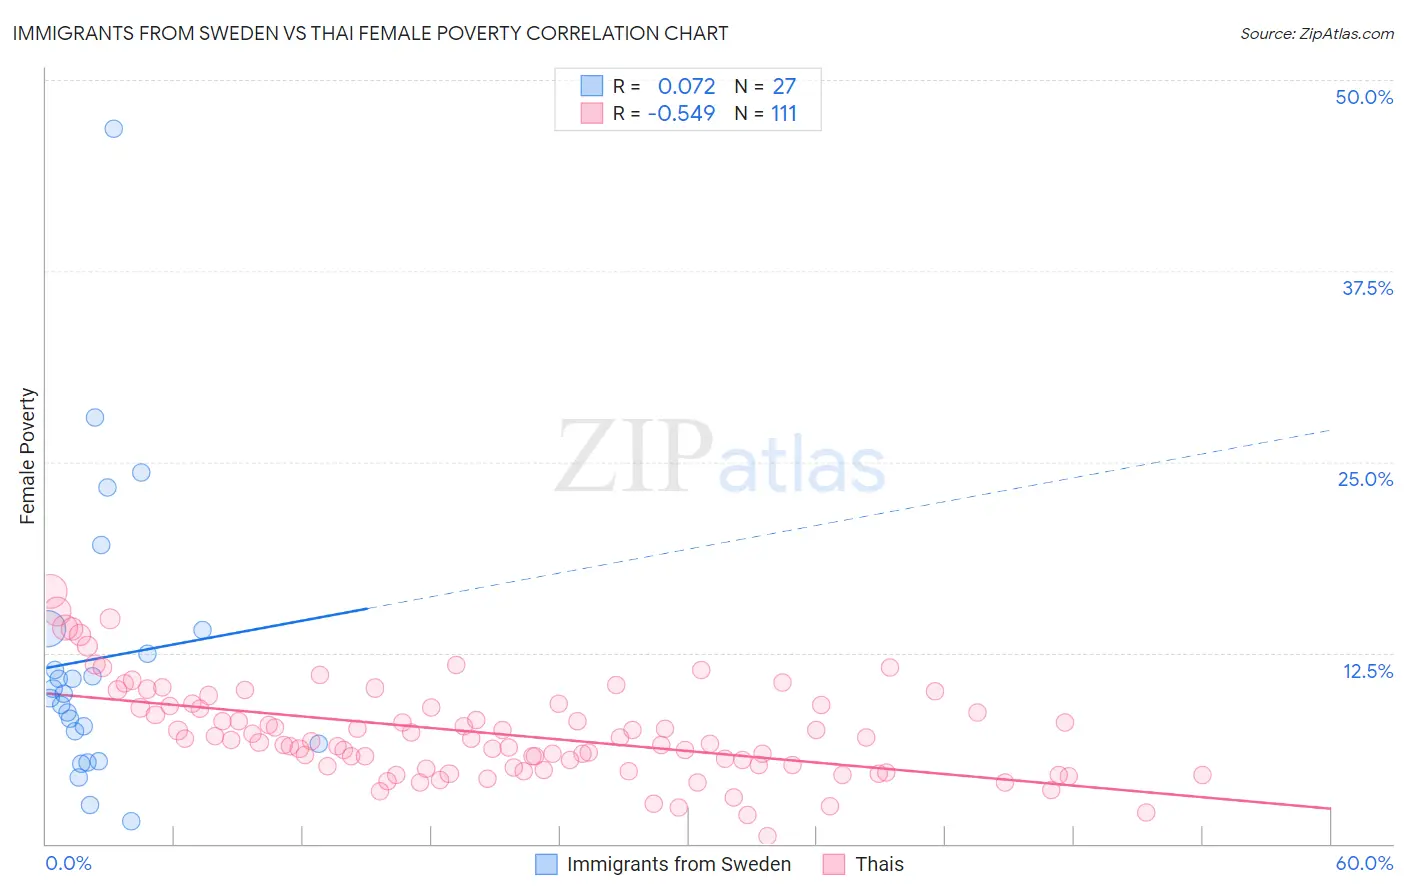
Immigrants from Sweden vs Thai Female Poverty Correlation Chart
The statistical analysis conducted on geographies consisting of 164,683,428 people shows a slight positive correlation between the proportion of Immigrants from Sweden and poverty level among females in the United States with a correlation coefficient (R) of 0.072 and weighted average of 12.3%. Similarly, the statistical analysis conducted on geographies consisting of 475,222,247 people shows a substantial negative correlation between the proportion of Thais and poverty level among females in the United States with a correlation coefficient (R) of -0.549 and weighted average of 10.5%, a difference of 17.7%.
Female Poverty Correlation Summary
| Measurement | Immigrants from Sweden | Thai |
| Minimum | 1.5% | 0.46% |
| Maximum | 46.8% | 16.5% |
| Range | 45.4% | 16.0% |
| Mean | 12.1% | 7.2% |
| Median | 9.8% | 6.8% |
| Interquartile 25% (IQ1) | 6.5% | 5.0% |
| Interquartile 75% (IQ3) | 14.0% | 9.0% |
| Interquartile Range (IQR) | 7.5% | 4.0% |
| Standard Deviation (Sample) | 9.5% | 3.1% |
| Standard Deviation (Population) | 9.3% | 3.0% |
Similar Demographics by Female Poverty
Demographics Similar to Immigrants from Sweden by Female Poverty
In terms of female poverty, the demographic groups most similar to Immigrants from Sweden are Slovak (12.3%, a difference of 0.0%), Jordanian (12.3%, a difference of 0.010%), Immigrants from North America (12.3%, a difference of 0.050%), Egyptian (12.3%, a difference of 0.12%), and Serbian (12.3%, a difference of 0.13%).
| Demographics | Rating | Rank | Female Poverty |
| Immigrants | Canada | 97.5 /100 | #74 | Exceptional 12.3% |
| Europeans | 97.4 /100 | #75 | Exceptional 12.3% |
| Immigrants | Eastern Europe | 97.2 /100 | #76 | Exceptional 12.3% |
| Serbians | 97.2 /100 | #77 | Exceptional 12.3% |
| Egyptians | 97.2 /100 | #78 | Exceptional 12.3% |
| Immigrants | North America | 97.1 /100 | #79 | Exceptional 12.3% |
| Slovaks | 97.1 /100 | #80 | Exceptional 12.3% |
| Immigrants | Sweden | 97.1 /100 | #81 | Exceptional 12.3% |
| Jordanians | 97.1 /100 | #82 | Exceptional 12.3% |
| Immigrants | England | 96.9 /100 | #83 | Exceptional 12.3% |
| Northern Europeans | 96.6 /100 | #84 | Exceptional 12.4% |
| Irish | 96.5 /100 | #85 | Exceptional 12.4% |
| Dutch | 96.5 /100 | #86 | Exceptional 12.4% |
| Okinawans | 96.4 /100 | #87 | Exceptional 12.4% |
| Finns | 96.4 /100 | #88 | Exceptional 12.4% |
Demographics Similar to Thais by Female Poverty
In terms of female poverty, the demographic groups most similar to Thais are Chinese (10.4%, a difference of 0.65%), Immigrants from Taiwan (10.5%, a difference of 0.76%), Filipino (10.9%, a difference of 4.7%), Immigrants from Ireland (11.0%, a difference of 5.1%), and Assyrian/Chaldean/Syriac (11.0%, a difference of 5.5%).
| Demographics | Rating | Rank | Female Poverty |
| Immigrants | India | 100.0 /100 | #1 | Exceptional 9.9% |
| Chinese | 100.0 /100 | #2 | Exceptional 10.4% |
| Thais | 100.0 /100 | #3 | Exceptional 10.5% |
| Immigrants | Taiwan | 100.0 /100 | #4 | Exceptional 10.5% |
| Filipinos | 100.0 /100 | #5 | Exceptional 10.9% |
| Immigrants | Ireland | 99.9 /100 | #6 | Exceptional 11.0% |
| Assyrians/Chaldeans/Syriacs | 99.9 /100 | #7 | Exceptional 11.0% |
| Immigrants | South Central Asia | 99.9 /100 | #8 | Exceptional 11.1% |
| Bulgarians | 99.9 /100 | #9 | Exceptional 11.1% |
| Immigrants | Hong Kong | 99.9 /100 | #10 | Exceptional 11.2% |
| Maltese | 99.9 /100 | #11 | Exceptional 11.2% |
| Bhutanese | 99.9 /100 | #12 | Exceptional 11.3% |
| Immigrants | Lithuania | 99.9 /100 | #13 | Exceptional 11.3% |
| Lithuanians | 99.8 /100 | #14 | Exceptional 11.4% |
| Latvians | 99.8 /100 | #15 | Exceptional 11.4% |