Immigrants from Ecuador vs Thai Kindergarten
COMPARE
Immigrants from Ecuador
Thai
Kindergarten
Kindergarten Comparison
Immigrants from Ecuador
Thais
96.9%
KINDERGARTEN
0.0/ 100
METRIC RATING
317th/ 347
METRIC RANK
98.2%
KINDERGARTEN
94.8/ 100
METRIC RATING
119th/ 347
METRIC RANK
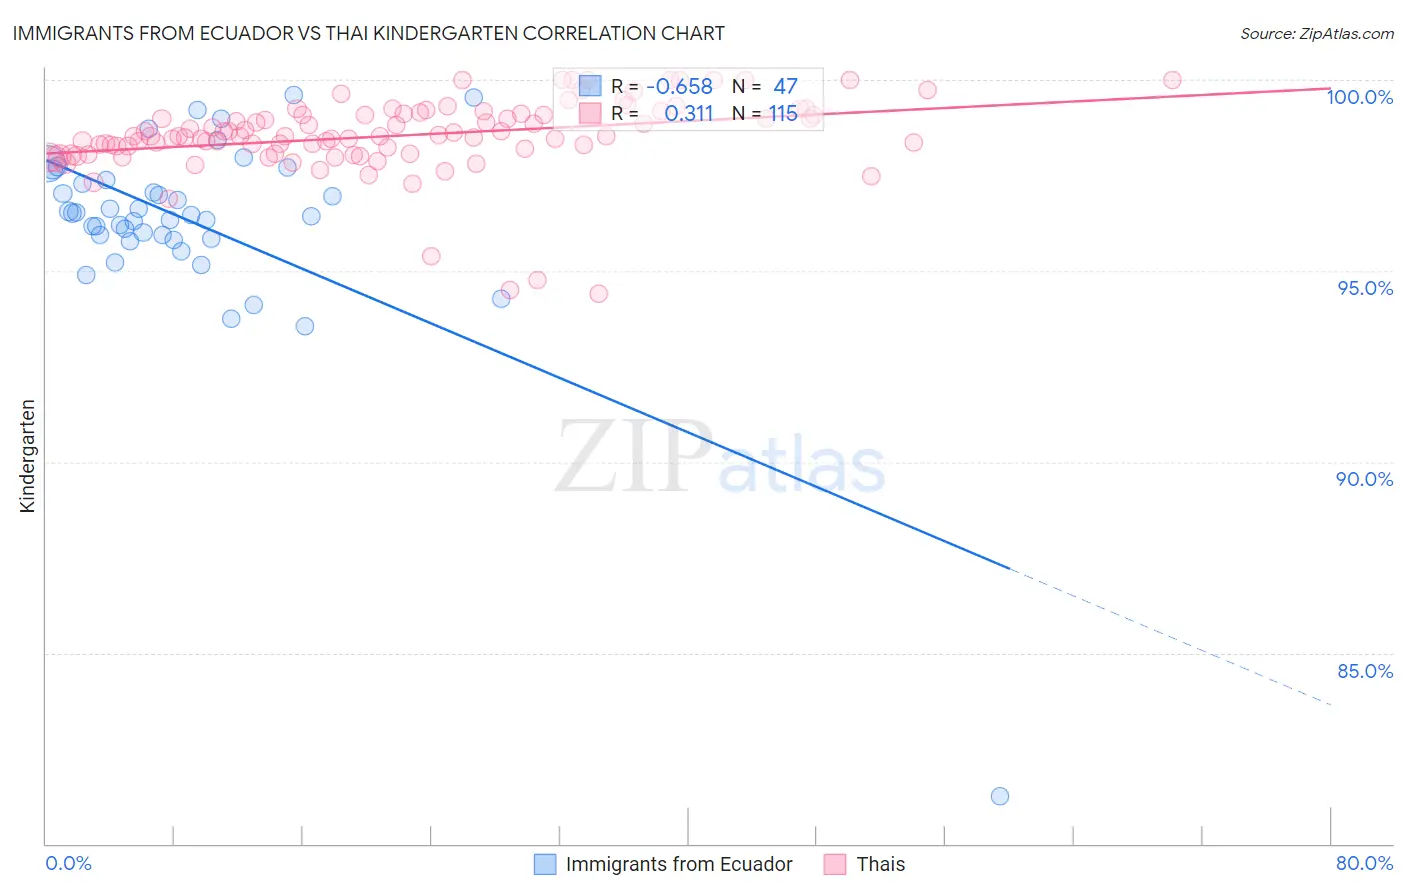
Immigrants from Ecuador vs Thai Kindergarten Correlation Chart
The statistical analysis conducted on geographies consisting of 271,020,679 people shows a significant negative correlation between the proportion of Immigrants from Ecuador and percentage of population with at least kindergarten education in the United States with a correlation coefficient (R) of -0.658 and weighted average of 96.9%. Similarly, the statistical analysis conducted on geographies consisting of 475,866,115 people shows a mild positive correlation between the proportion of Thais and percentage of population with at least kindergarten education in the United States with a correlation coefficient (R) of 0.311 and weighted average of 98.2%, a difference of 1.3%.
Kindergarten Correlation Summary
| Measurement | Immigrants from Ecuador | Thai |
| Minimum | 81.2% | 94.4% |
| Maximum | 99.6% | 100.0% |
| Range | 18.3% | 5.6% |
| Mean | 96.3% | 98.5% |
| Median | 96.5% | 98.5% |
| Interquartile 25% (IQ1) | 95.8% | 98.1% |
| Interquartile 75% (IQ3) | 97.4% | 99.1% |
| Interquartile Range (IQR) | 1.5% | 1.0% |
| Standard Deviation (Sample) | 2.6% | 0.99% |
| Standard Deviation (Population) | 2.6% | 0.99% |
Similar Demographics by Kindergarten
Demographics Similar to Immigrants from Ecuador by Kindergarten
In terms of kindergarten, the demographic groups most similar to Immigrants from Ecuador are Immigrants from Nicaragua (96.9%, a difference of 0.0%), Immigrants from Belize (96.9%, a difference of 0.010%), Cape Verdean (96.9%, a difference of 0.030%), Honduran (96.9%, a difference of 0.030%), and Guyanese (96.9%, a difference of 0.040%).
| Demographics | Rating | Rank | Kindergarten |
| Immigrants | Azores | 0.0 /100 | #310 | Tragic 97.0% |
| Sri Lankans | 0.0 /100 | #311 | Tragic 97.0% |
| Guyanese | 0.0 /100 | #312 | Tragic 96.9% |
| Cape Verdeans | 0.0 /100 | #313 | Tragic 96.9% |
| Hondurans | 0.0 /100 | #314 | Tragic 96.9% |
| Immigrants | Belize | 0.0 /100 | #315 | Tragic 96.9% |
| Immigrants | Nicaragua | 0.0 /100 | #316 | Tragic 96.9% |
| Immigrants | Ecuador | 0.0 /100 | #317 | Tragic 96.9% |
| Immigrants | Laos | 0.0 /100 | #318 | Tragic 96.9% |
| Immigrants | Guyana | 0.0 /100 | #319 | Tragic 96.8% |
| Immigrants | Burma/Myanmar | 0.0 /100 | #320 | Tragic 96.8% |
| Immigrants | Bangladesh | 0.0 /100 | #321 | Tragic 96.8% |
| Mexican American Indians | 0.0 /100 | #322 | Tragic 96.8% |
| Immigrants | Honduras | 0.0 /100 | #323 | Tragic 96.8% |
| Vietnamese | 0.0 /100 | #324 | Tragic 96.8% |
Demographics Similar to Thais by Kindergarten
In terms of kindergarten, the demographic groups most similar to Thais are Immigrants from France (98.2%, a difference of 0.010%), Yugoslavian (98.2%, a difference of 0.010%), Okinawan (98.2%, a difference of 0.010%), Immigrants from Zimbabwe (98.2%, a difference of 0.010%), and Immigrants from Japan (98.2%, a difference of 0.010%).
| Demographics | Rating | Rank | Kindergarten |
| Immigrants | Czechoslovakia | 96.6 /100 | #112 | Exceptional 98.2% |
| Immigrants | Latvia | 96.3 /100 | #113 | Exceptional 98.2% |
| Ute | 96.3 /100 | #114 | Exceptional 98.2% |
| Iranians | 96.2 /100 | #115 | Exceptional 98.2% |
| Spanish | 95.8 /100 | #116 | Exceptional 98.2% |
| Immigrants | France | 95.5 /100 | #117 | Exceptional 98.2% |
| Yugoslavians | 95.5 /100 | #118 | Exceptional 98.2% |
| Thais | 94.8 /100 | #119 | Exceptional 98.2% |
| Okinawans | 94.4 /100 | #120 | Exceptional 98.2% |
| Immigrants | Zimbabwe | 94.0 /100 | #121 | Exceptional 98.2% |
| Immigrants | Japan | 94.0 /100 | #122 | Exceptional 98.2% |
| Menominee | 93.9 /100 | #123 | Exceptional 98.2% |
| Syrians | 93.6 /100 | #124 | Exceptional 98.2% |
| Iroquois | 93.5 /100 | #125 | Exceptional 98.2% |
| Lebanese | 93.5 /100 | #126 | Exceptional 98.2% |