Immigrants from Eastern Europe vs Turkish Family Poverty
COMPARE
Immigrants from Eastern Europe
Turkish
Family Poverty
Family Poverty Comparison
Immigrants from Eastern Europe
Turks
8.1%
FAMILY POVERTY
95.6/ 100
METRIC RATING
103rd/ 347
METRIC RANK
7.5%
FAMILY POVERTY
99.4/ 100
METRIC RATING
36th/ 347
METRIC RANK
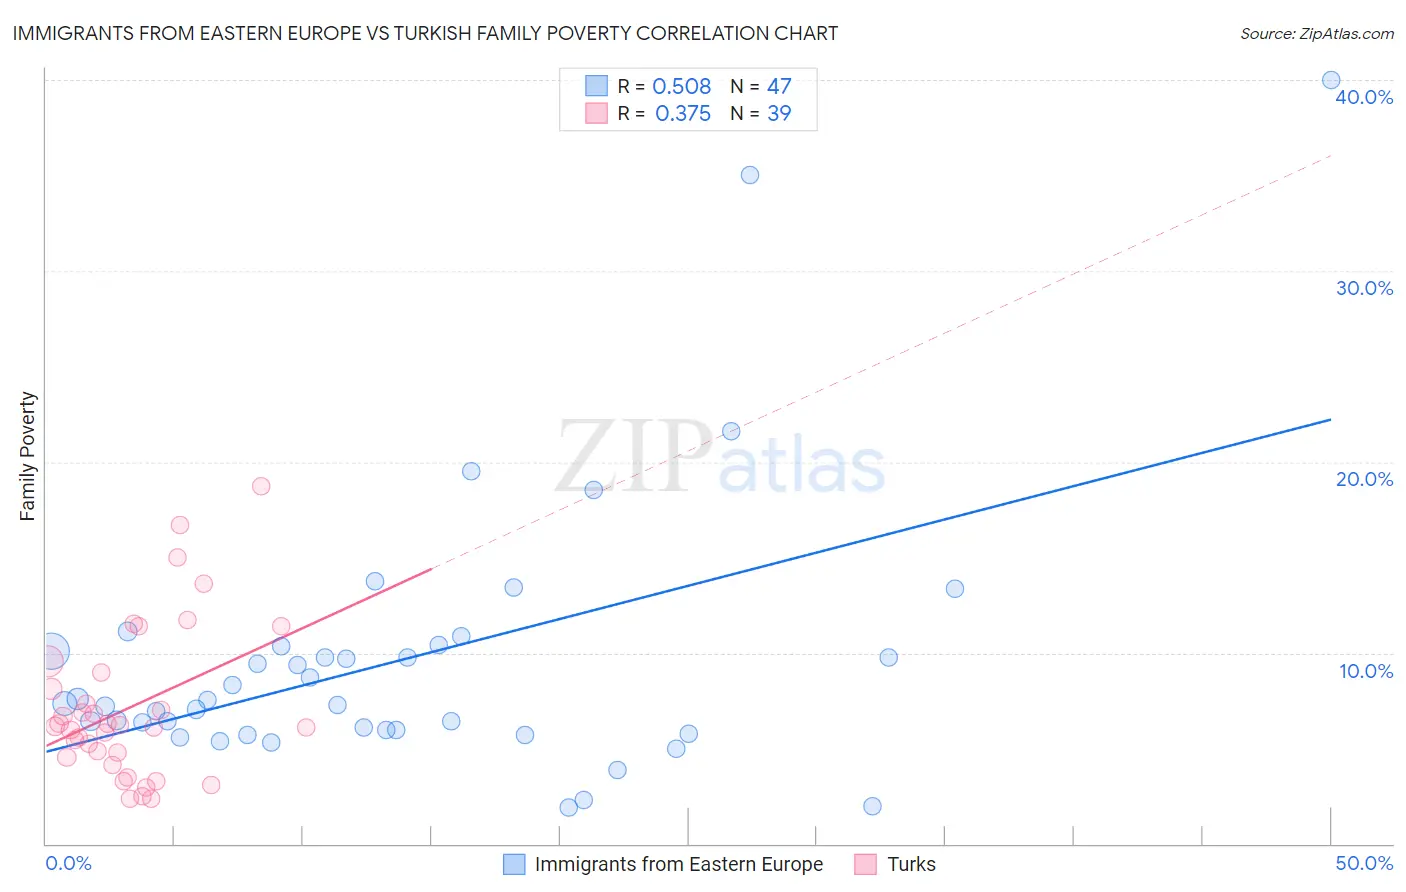
Immigrants from Eastern Europe vs Turkish Family Poverty Correlation Chart
The statistical analysis conducted on geographies consisting of 473,559,356 people shows a substantial positive correlation between the proportion of Immigrants from Eastern Europe and poverty level among families in the United States with a correlation coefficient (R) of 0.508 and weighted average of 8.1%. Similarly, the statistical analysis conducted on geographies consisting of 271,236,955 people shows a mild positive correlation between the proportion of Turks and poverty level among families in the United States with a correlation coefficient (R) of 0.375 and weighted average of 7.5%, a difference of 7.9%.
Family Poverty Correlation Summary
| Measurement | Immigrants from Eastern Europe | Turkish |
| Minimum | 1.9% | 2.4% |
| Maximum | 40.0% | 18.7% |
| Range | 38.1% | 16.3% |
| Mean | 9.6% | 7.1% |
| Median | 7.4% | 6.1% |
| Interquartile 25% (IQ1) | 5.9% | 4.5% |
| Interquartile 75% (IQ3) | 10.4% | 9.0% |
| Interquartile Range (IQR) | 4.4% | 4.4% |
| Standard Deviation (Sample) | 7.2% | 4.0% |
| Standard Deviation (Population) | 7.1% | 3.9% |
Similar Demographics by Family Poverty
Demographics Similar to Immigrants from Eastern Europe by Family Poverty
In terms of family poverty, the demographic groups most similar to Immigrants from Eastern Europe are Slavic (8.1%, a difference of 0.010%), Laotian (8.1%, a difference of 0.040%), Immigrants from Indonesia (8.1%, a difference of 0.090%), Immigrants from Norway (8.1%, a difference of 0.10%), and New Zealander (8.1%, a difference of 0.13%).
| Demographics | Rating | Rank | Family Poverty |
| Immigrants | Turkey | 96.5 /100 | #96 | Exceptional 8.0% |
| Immigrants | Switzerland | 96.1 /100 | #97 | Exceptional 8.1% |
| Immigrants | South Africa | 95.9 /100 | #98 | Exceptional 8.1% |
| Welsh | 95.8 /100 | #99 | Exceptional 8.1% |
| New Zealanders | 95.8 /100 | #100 | Exceptional 8.1% |
| Immigrants | Norway | 95.7 /100 | #101 | Exceptional 8.1% |
| Immigrants | Indonesia | 95.7 /100 | #102 | Exceptional 8.1% |
| Immigrants | Eastern Europe | 95.6 /100 | #103 | Exceptional 8.1% |
| Slavs | 95.6 /100 | #104 | Exceptional 8.1% |
| Laotians | 95.6 /100 | #105 | Exceptional 8.1% |
| Egyptians | 95.1 /100 | #106 | Exceptional 8.1% |
| French Canadians | 95.0 /100 | #107 | Exceptional 8.1% |
| Basques | 94.9 /100 | #108 | Exceptional 8.1% |
| Jordanians | 94.8 /100 | #109 | Exceptional 8.2% |
| Romanians | 94.7 /100 | #110 | Exceptional 8.2% |
Demographics Similar to Turks by Family Poverty
In terms of family poverty, the demographic groups most similar to Turks are Greek (7.5%, a difference of 0.010%), Estonian (7.5%, a difference of 0.17%), Bolivian (7.5%, a difference of 0.41%), Carpatho Rusyn (7.5%, a difference of 0.47%), and Slovene (7.5%, a difference of 0.51%).
| Demographics | Rating | Rank | Family Poverty |
| Immigrants | Northern Europe | 99.6 /100 | #29 | Exceptional 7.4% |
| Italians | 99.6 /100 | #30 | Exceptional 7.4% |
| Czechs | 99.6 /100 | #31 | Exceptional 7.4% |
| Poles | 99.5 /100 | #32 | Exceptional 7.4% |
| Immigrants | Japan | 99.5 /100 | #33 | Exceptional 7.4% |
| Russians | 99.5 /100 | #34 | Exceptional 7.5% |
| Greeks | 99.4 /100 | #35 | Exceptional 7.5% |
| Turks | 99.4 /100 | #36 | Exceptional 7.5% |
| Estonians | 99.4 /100 | #37 | Exceptional 7.5% |
| Bolivians | 99.3 /100 | #38 | Exceptional 7.5% |
| Carpatho Rusyns | 99.3 /100 | #39 | Exceptional 7.5% |
| Slovenes | 99.3 /100 | #40 | Exceptional 7.5% |
| Immigrants | Australia | 99.2 /100 | #41 | Exceptional 7.6% |
| Scandinavians | 99.1 /100 | #42 | Exceptional 7.6% |
| Immigrants | Austria | 99.1 /100 | #43 | Exceptional 7.6% |