Immigrants from Croatia vs Tongan College, 1 year or more
COMPARE
Immigrants from Croatia
Tongan
College, 1 year or more
College, 1 year or more Comparison
Immigrants from Croatia
Tongans
62.3%
COLLEGE, 1 YEAR OR MORE
97.6/ 100
METRIC RATING
94th/ 347
METRIC RANK
57.8%
COLLEGE, 1 YEAR OR MORE
11.6/ 100
METRIC RATING
215th/ 347
METRIC RANK
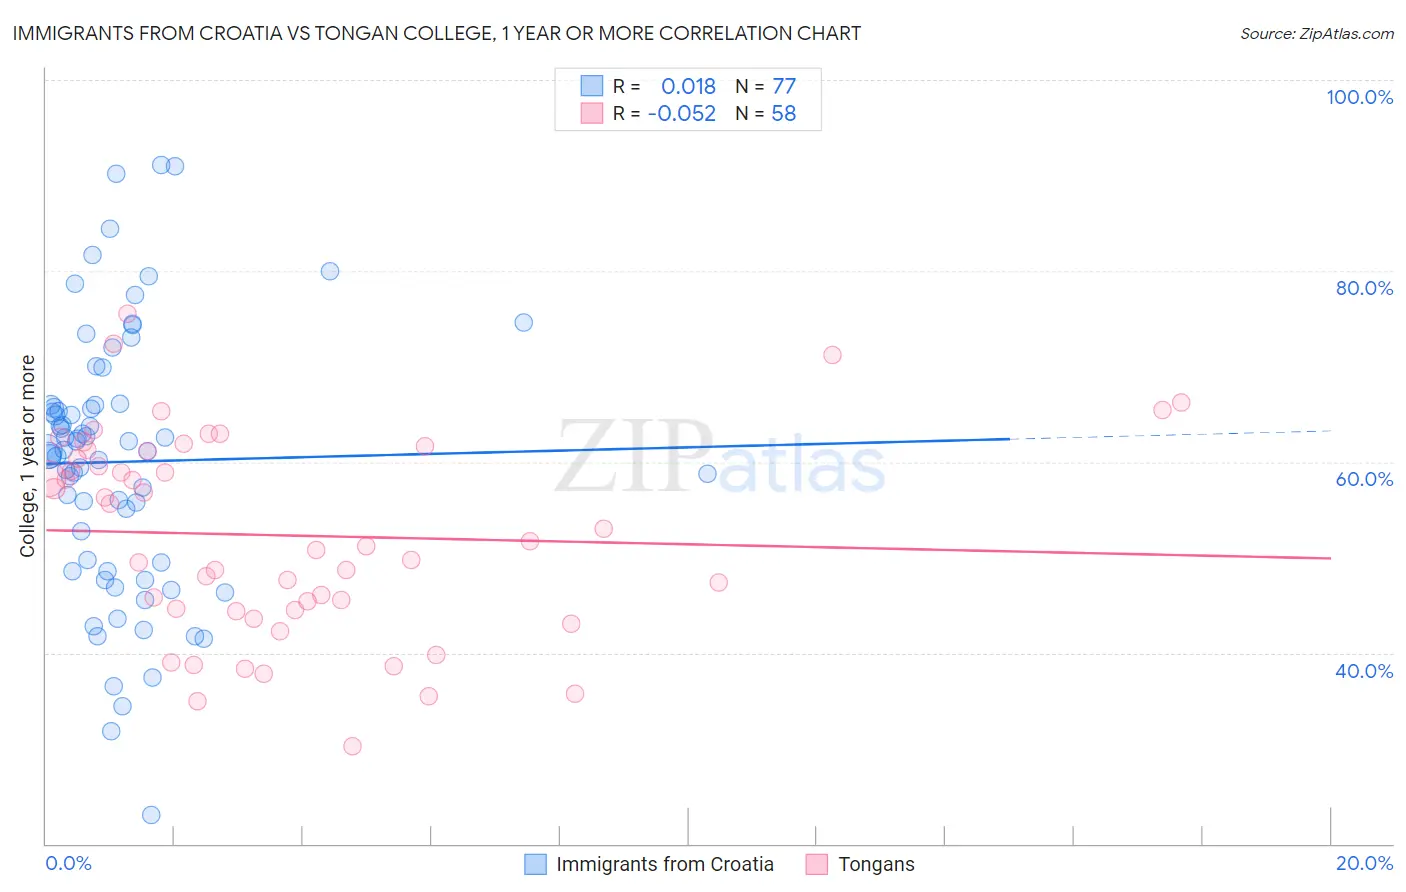
Immigrants from Croatia vs Tongan College, 1 year or more Correlation Chart
The statistical analysis conducted on geographies consisting of 132,577,989 people shows no correlation between the proportion of Immigrants from Croatia and percentage of population with at least college, 1 year or more education in the United States with a correlation coefficient (R) of 0.018 and weighted average of 62.3%. Similarly, the statistical analysis conducted on geographies consisting of 102,908,759 people shows a slight negative correlation between the proportion of Tongans and percentage of population with at least college, 1 year or more education in the United States with a correlation coefficient (R) of -0.052 and weighted average of 57.8%, a difference of 7.8%.
College, 1 year or more Correlation Summary
| Measurement | Immigrants from Croatia | Tongan |
| Minimum | 23.1% | 30.2% |
| Maximum | 91.1% | 75.6% |
| Range | 68.0% | 45.4% |
| Mean | 60.0% | 52.3% |
| Median | 61.2% | 51.4% |
| Interquartile 25% (IQ1) | 49.0% | 44.5% |
| Interquartile 75% (IQ3) | 66.0% | 61.1% |
| Interquartile Range (IQR) | 17.0% | 16.6% |
| Standard Deviation (Sample) | 13.8% | 10.5% |
| Standard Deviation (Population) | 13.7% | 10.5% |
Similar Demographics by College, 1 year or more
Demographics Similar to Immigrants from Croatia by College, 1 year or more
In terms of college, 1 year or more, the demographic groups most similar to Immigrants from Croatia are Romanian (62.4%, a difference of 0.060%), Immigrants from Eastern Europe (62.4%, a difference of 0.090%), Immigrants from Egypt (62.4%, a difference of 0.090%), British (62.3%, a difference of 0.10%), and Immigrants from Western Asia (62.5%, a difference of 0.20%).
| Demographics | Rating | Rank | College, 1 year or more |
| Immigrants | Hungary | 98.6 /100 | #87 | Exceptional 62.7% |
| Greeks | 98.3 /100 | #88 | Exceptional 62.6% |
| Immigrants | Ethiopia | 98.2 /100 | #89 | Exceptional 62.6% |
| Immigrants | Western Asia | 97.9 /100 | #90 | Exceptional 62.5% |
| Immigrants | Eastern Europe | 97.8 /100 | #91 | Exceptional 62.4% |
| Immigrants | Egypt | 97.8 /100 | #92 | Exceptional 62.4% |
| Romanians | 97.7 /100 | #93 | Exceptional 62.4% |
| Immigrants | Croatia | 97.6 /100 | #94 | Exceptional 62.3% |
| British | 97.4 /100 | #95 | Exceptional 62.3% |
| Chinese | 97.2 /100 | #96 | Exceptional 62.2% |
| Jordanians | 97.2 /100 | #97 | Exceptional 62.2% |
| Carpatho Rusyns | 97.2 /100 | #98 | Exceptional 62.2% |
| Croatians | 97.1 /100 | #99 | Exceptional 62.2% |
| Icelanders | 96.8 /100 | #100 | Exceptional 62.1% |
| Swedes | 96.8 /100 | #101 | Exceptional 62.1% |
Demographics Similar to Tongans by College, 1 year or more
In terms of college, 1 year or more, the demographic groups most similar to Tongans are Immigrants from Colombia (57.8%, a difference of 0.0%), Immigrants from Senegal (57.8%, a difference of 0.040%), French Canadian (57.8%, a difference of 0.040%), Immigrants from Peru (57.7%, a difference of 0.13%), and Immigrants from Nigeria (57.9%, a difference of 0.21%).
| Demographics | Rating | Rank | College, 1 year or more |
| Immigrants | Uruguay | 15.2 /100 | #208 | Poor 58.1% |
| Immigrants | Middle Africa | 14.0 /100 | #209 | Poor 58.0% |
| Tsimshian | 13.5 /100 | #210 | Poor 57.9% |
| Immigrants | Nigeria | 13.3 /100 | #211 | Poor 57.9% |
| Immigrants | Senegal | 11.8 /100 | #212 | Poor 57.8% |
| French Canadians | 11.8 /100 | #213 | Poor 57.8% |
| Immigrants | Colombia | 11.6 /100 | #214 | Poor 57.8% |
| Tongans | 11.6 /100 | #215 | Poor 57.8% |
| Immigrants | Peru | 10.6 /100 | #216 | Poor 57.7% |
| Immigrants | Panama | 9.1 /100 | #217 | Tragic 57.6% |
| Native Hawaiians | 9.0 /100 | #218 | Tragic 57.6% |
| Whites/Caucasians | 8.7 /100 | #219 | Tragic 57.6% |
| Immigrants | Costa Rica | 8.0 /100 | #220 | Tragic 57.5% |
| Immigrants | Ghana | 7.7 /100 | #221 | Tragic 57.4% |
| Sub-Saharan Africans | 6.1 /100 | #222 | Tragic 57.3% |