Immigrants from Croatia vs Immigrants from Switzerland Family Poverty
COMPARE
Immigrants from Croatia
Immigrants from Switzerland
Family Poverty
Family Poverty Comparison
Immigrants from Croatia
Immigrants from Switzerland
7.8%
FAMILY POVERTY
98.1/ 100
METRIC RATING
75th/ 347
METRIC RANK
8.1%
FAMILY POVERTY
96.1/ 100
METRIC RATING
97th/ 347
METRIC RANK
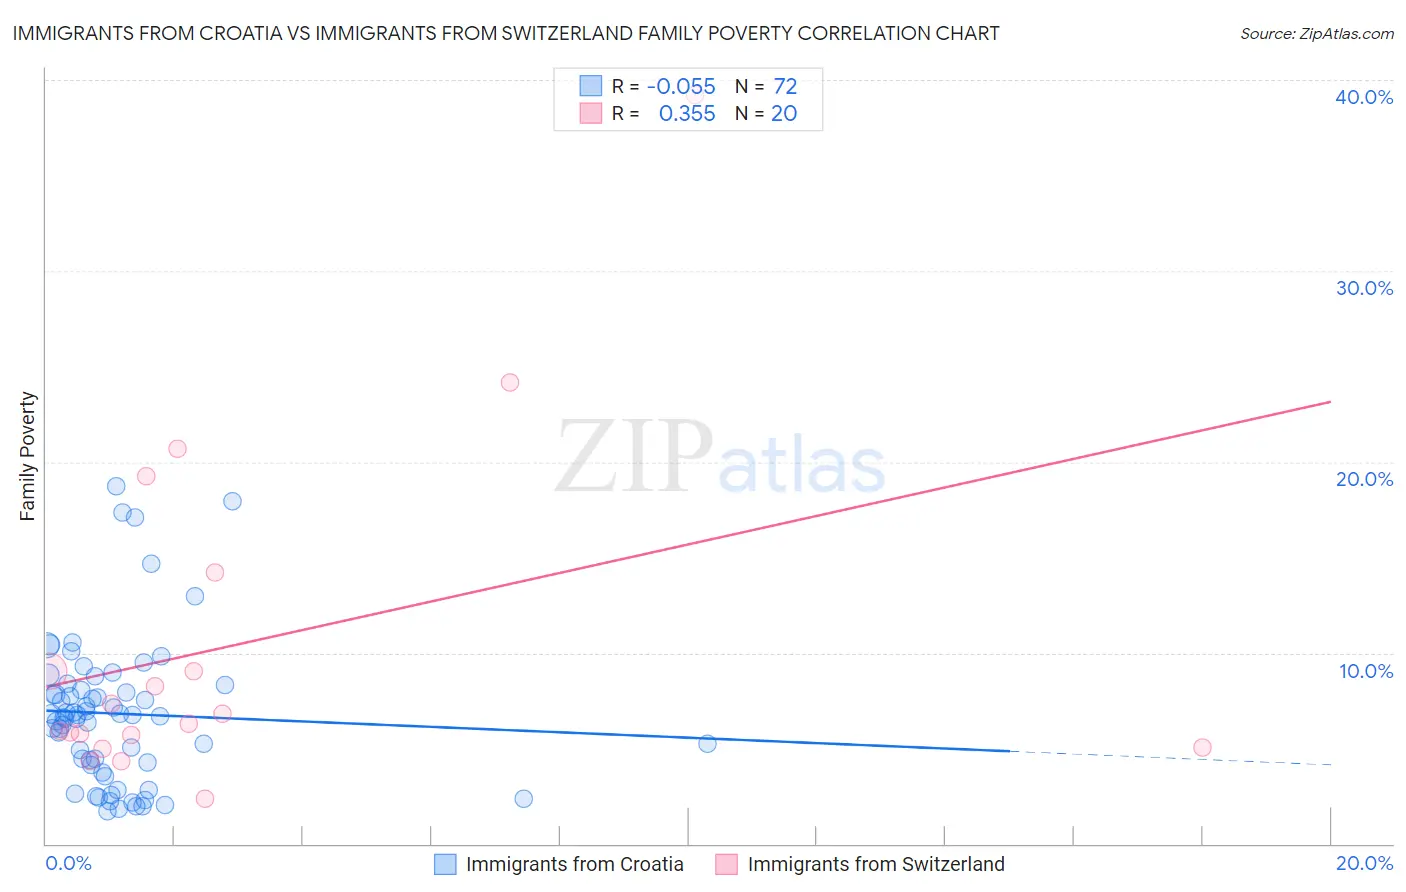
Immigrants from Croatia vs Immigrants from Switzerland Family Poverty Correlation Chart
The statistical analysis conducted on geographies consisting of 132,458,844 people shows a slight negative correlation between the proportion of Immigrants from Croatia and poverty level among families in the United States with a correlation coefficient (R) of -0.055 and weighted average of 7.8%. Similarly, the statistical analysis conducted on geographies consisting of 147,922,472 people shows a mild positive correlation between the proportion of Immigrants from Switzerland and poverty level among families in the United States with a correlation coefficient (R) of 0.355 and weighted average of 8.1%, a difference of 2.7%.
Family Poverty Correlation Summary
| Measurement | Immigrants from Croatia | Immigrants from Switzerland |
| Minimum | 1.7% | 2.3% |
| Maximum | 18.7% | 39.2% |
| Range | 17.0% | 36.8% |
| Mean | 6.8% | 10.4% |
| Median | 6.7% | 6.5% |
| Interquartile 25% (IQ1) | 4.2% | 5.4% |
| Interquartile 75% (IQ3) | 8.2% | 11.6% |
| Interquartile Range (IQR) | 4.0% | 6.3% |
| Standard Deviation (Sample) | 3.9% | 9.0% |
| Standard Deviation (Population) | 3.8% | 8.8% |
Similar Demographics by Family Poverty
Demographics Similar to Immigrants from Croatia by Family Poverty
In terms of family poverty, the demographic groups most similar to Immigrants from Croatia are Immigrants from China (7.8%, a difference of 0.14%), Immigrants from Romania (7.8%, a difference of 0.21%), Austrian (7.8%, a difference of 0.21%), Immigrants from Latvia (7.9%, a difference of 0.23%), and Ukrainian (7.9%, a difference of 0.24%).
| Demographics | Rating | Rank | Family Poverty |
| Australians | 98.2 /100 | #68 | Exceptional 7.8% |
| Immigrants | Belgium | 98.2 /100 | #69 | Exceptional 7.8% |
| Immigrants | Canada | 98.2 /100 | #70 | Exceptional 7.8% |
| Cambodians | 98.2 /100 | #71 | Exceptional 7.8% |
| Immigrants | Romania | 98.2 /100 | #72 | Exceptional 7.8% |
| Austrians | 98.2 /100 | #73 | Exceptional 7.8% |
| Immigrants | China | 98.1 /100 | #74 | Exceptional 7.8% |
| Immigrants | Croatia | 98.1 /100 | #75 | Exceptional 7.8% |
| Immigrants | Latvia | 98.0 /100 | #76 | Exceptional 7.9% |
| Ukrainians | 98.0 /100 | #77 | Exceptional 7.9% |
| Immigrants | North America | 97.9 /100 | #78 | Exceptional 7.9% |
| Immigrants | Europe | 97.8 /100 | #79 | Exceptional 7.9% |
| English | 97.8 /100 | #80 | Exceptional 7.9% |
| Irish | 97.8 /100 | #81 | Exceptional 7.9% |
| Immigrants | Poland | 97.8 /100 | #82 | Exceptional 7.9% |
Demographics Similar to Immigrants from Switzerland by Family Poverty
In terms of family poverty, the demographic groups most similar to Immigrants from Switzerland are Immigrants from South Africa (8.1%, a difference of 0.21%), Welsh (8.1%, a difference of 0.28%), New Zealander (8.1%, a difference of 0.35%), Immigrants from Norway (8.1%, a difference of 0.38%), and Immigrants from Indonesia (8.1%, a difference of 0.39%).
| Demographics | Rating | Rank | Family Poverty |
| Immigrants | England | 97.1 /100 | #90 | Exceptional 8.0% |
| Immigrants | Italy | 97.0 /100 | #91 | Exceptional 8.0% |
| Czechoslovakians | 96.8 /100 | #92 | Exceptional 8.0% |
| Tlingit-Haida | 96.7 /100 | #93 | Exceptional 8.0% |
| Immigrants | Pakistan | 96.6 /100 | #94 | Exceptional 8.0% |
| Immigrants | Philippines | 96.5 /100 | #95 | Exceptional 8.0% |
| Immigrants | Turkey | 96.5 /100 | #96 | Exceptional 8.0% |
| Immigrants | Switzerland | 96.1 /100 | #97 | Exceptional 8.1% |
| Immigrants | South Africa | 95.9 /100 | #98 | Exceptional 8.1% |
| Welsh | 95.8 /100 | #99 | Exceptional 8.1% |
| New Zealanders | 95.8 /100 | #100 | Exceptional 8.1% |
| Immigrants | Norway | 95.7 /100 | #101 | Exceptional 8.1% |
| Immigrants | Indonesia | 95.7 /100 | #102 | Exceptional 8.1% |
| Immigrants | Eastern Europe | 95.6 /100 | #103 | Exceptional 8.1% |
| Slavs | 95.6 /100 | #104 | Exceptional 8.1% |