Immigrants from Croatia vs Immigrants from Congo Child Poverty Under the Age of 5
COMPARE
Immigrants from Croatia
Immigrants from Congo
Child Poverty Under the Age of 5
Child Poverty Under the Age of 5 Comparison
Immigrants from Croatia
Immigrants from Congo
15.6%
CHILD POVERTY UNDER THE AGE OF 5
97.3/ 100
METRIC RATING
89th/ 347
METRIC RANK
23.9%
CHILD POVERTY UNDER THE AGE OF 5
0.0/ 100
METRIC RATING
325th/ 347
METRIC RANK
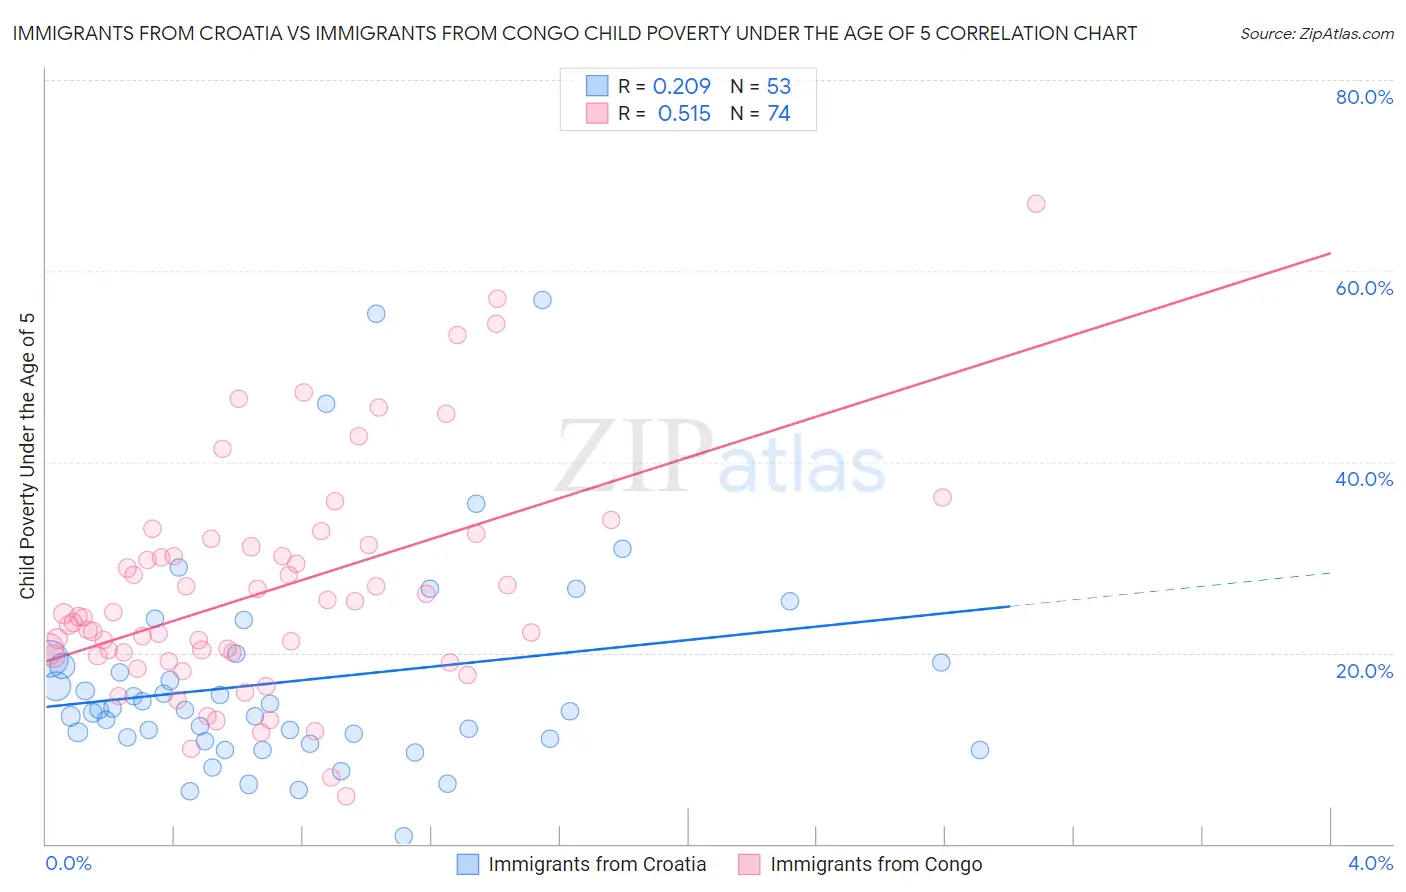
Immigrants from Croatia vs Immigrants from Congo Child Poverty Under the Age of 5 Correlation Chart
The statistical analysis conducted on geographies consisting of 129,139,038 people shows a weak positive correlation between the proportion of Immigrants from Croatia and poverty level among children under the age of 5 in the United States with a correlation coefficient (R) of 0.209 and weighted average of 15.6%. Similarly, the statistical analysis conducted on geographies consisting of 91,481,308 people shows a substantial positive correlation between the proportion of Immigrants from Congo and poverty level among children under the age of 5 in the United States with a correlation coefficient (R) of 0.515 and weighted average of 23.9%, a difference of 52.7%.
Child Poverty Under the Age of 5 Correlation Summary
| Measurement | Immigrants from Croatia | Immigrants from Congo |
| Minimum | 0.81% | 5.0% |
| Maximum | 57.0% | 67.1% |
| Range | 56.2% | 62.1% |
| Mean | 17.0% | 26.4% |
| Median | 14.0% | 23.8% |
| Interquartile 25% (IQ1) | 10.9% | 19.7% |
| Interquartile 75% (IQ3) | 19.1% | 31.1% |
| Interquartile Range (IQR) | 8.3% | 11.4% |
| Standard Deviation (Sample) | 11.2% | 11.8% |
| Standard Deviation (Population) | 11.1% | 11.7% |
Similar Demographics by Child Poverty Under the Age of 5
Demographics Similar to Immigrants from Croatia by Child Poverty Under the Age of 5
In terms of child poverty under the age of 5, the demographic groups most similar to Immigrants from Croatia are Immigrants from France (15.6%, a difference of 0.0%), Jordanian (15.6%, a difference of 0.060%), Polish (15.7%, a difference of 0.11%), Immigrants from Vietnam (15.6%, a difference of 0.12%), and Scandinavian (15.7%, a difference of 0.18%).
| Demographics | Rating | Rank | Child Poverty Under the Age of 5 |
| Immigrants | Italy | 97.7 /100 | #82 | Exceptional 15.6% |
| Chileans | 97.6 /100 | #83 | Exceptional 15.6% |
| Immigrants | Netherlands | 97.6 /100 | #84 | Exceptional 15.6% |
| Immigrants | Latvia | 97.4 /100 | #85 | Exceptional 15.6% |
| Immigrants | Malaysia | 97.4 /100 | #86 | Exceptional 15.6% |
| Immigrants | Vietnam | 97.4 /100 | #87 | Exceptional 15.6% |
| Jordanians | 97.3 /100 | #88 | Exceptional 15.6% |
| Immigrants | Croatia | 97.3 /100 | #89 | Exceptional 15.6% |
| Immigrants | France | 97.3 /100 | #90 | Exceptional 15.6% |
| Poles | 97.2 /100 | #91 | Exceptional 15.7% |
| Scandinavians | 97.1 /100 | #92 | Exceptional 15.7% |
| Ukrainians | 97.1 /100 | #93 | Exceptional 15.7% |
| Immigrants | South Eastern Asia | 97.1 /100 | #94 | Exceptional 15.7% |
| Immigrants | Switzerland | 96.4 /100 | #95 | Exceptional 15.8% |
| Immigrants | Kazakhstan | 96.2 /100 | #96 | Exceptional 15.8% |
Demographics Similar to Immigrants from Congo by Child Poverty Under the Age of 5
In terms of child poverty under the age of 5, the demographic groups most similar to Immigrants from Congo are Central American Indian (23.9%, a difference of 0.18%), Paiute (23.8%, a difference of 0.21%), Dominican (24.0%, a difference of 0.64%), Immigrants from Dominican Republic (24.1%, a difference of 0.73%), and Pueblo (23.7%, a difference of 0.82%).
| Demographics | Rating | Rank | Child Poverty Under the Age of 5 |
| Dutch West Indians | 0.0 /100 | #318 | Tragic 23.3% |
| Chippewa | 0.0 /100 | #319 | Tragic 23.4% |
| Choctaw | 0.0 /100 | #320 | Tragic 23.5% |
| Immigrants | Honduras | 0.0 /100 | #321 | Tragic 23.5% |
| Ute | 0.0 /100 | #322 | Tragic 23.5% |
| Pueblo | 0.0 /100 | #323 | Tragic 23.7% |
| Paiute | 0.0 /100 | #324 | Tragic 23.8% |
| Immigrants | Congo | 0.0 /100 | #325 | Tragic 23.9% |
| Central American Indians | 0.0 /100 | #326 | Tragic 23.9% |
| Dominicans | 0.0 /100 | #327 | Tragic 24.0% |
| Immigrants | Dominican Republic | 0.0 /100 | #328 | Tragic 24.1% |
| Cajuns | 0.0 /100 | #329 | Tragic 24.1% |
| Creek | 0.0 /100 | #330 | Tragic 24.2% |
| Kiowa | 0.0 /100 | #331 | Tragic 24.5% |
| Apache | 0.0 /100 | #332 | Tragic 25.0% |