Immigrants from Croatia vs Japanese Family Poverty
COMPARE
Immigrants from Croatia
Japanese
Family Poverty
Family Poverty Comparison
Immigrants from Croatia
Japanese
7.8%
FAMILY POVERTY
98.1/ 100
METRIC RATING
75th/ 347
METRIC RANK
9.9%
FAMILY POVERTY
4.8/ 100
METRIC RATING
222nd/ 347
METRIC RANK
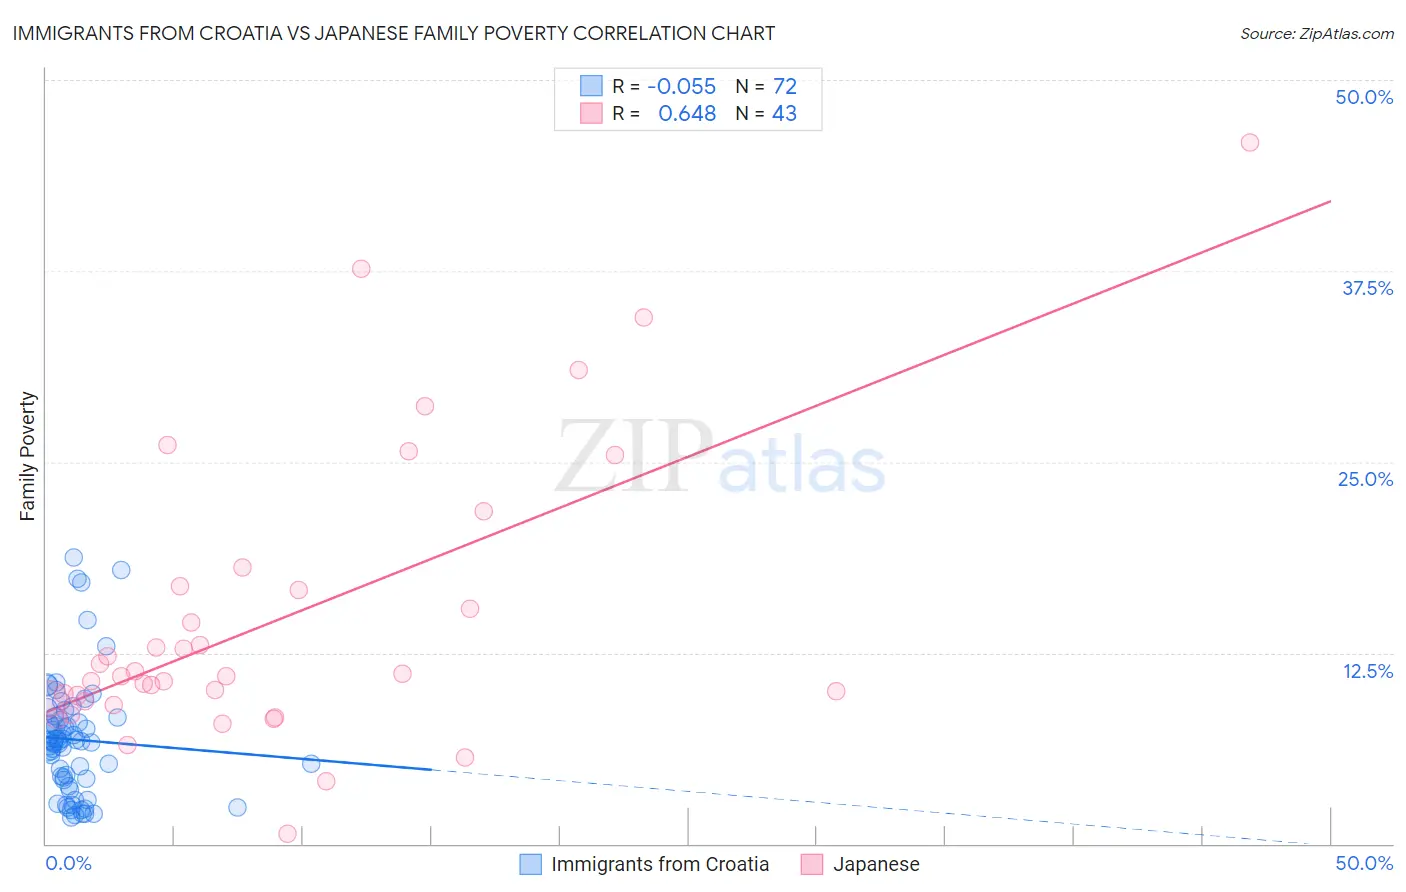
Immigrants from Croatia vs Japanese Family Poverty Correlation Chart
The statistical analysis conducted on geographies consisting of 132,458,844 people shows a slight negative correlation between the proportion of Immigrants from Croatia and poverty level among families in the United States with a correlation coefficient (R) of -0.055 and weighted average of 7.8%. Similarly, the statistical analysis conducted on geographies consisting of 248,852,848 people shows a significant positive correlation between the proportion of Japanese and poverty level among families in the United States with a correlation coefficient (R) of 0.648 and weighted average of 9.9%, a difference of 26.0%.
Family Poverty Correlation Summary
| Measurement | Immigrants from Croatia | Japanese |
| Minimum | 1.7% | 0.66% |
| Maximum | 18.7% | 45.9% |
| Range | 17.0% | 45.3% |
| Mean | 6.8% | 14.7% |
| Median | 6.7% | 11.0% |
| Interquartile 25% (IQ1) | 4.2% | 9.3% |
| Interquartile 75% (IQ3) | 8.2% | 16.8% |
| Interquartile Range (IQR) | 4.0% | 7.5% |
| Standard Deviation (Sample) | 3.9% | 9.5% |
| Standard Deviation (Population) | 3.8% | 9.4% |
Similar Demographics by Family Poverty
Demographics Similar to Immigrants from Croatia by Family Poverty
In terms of family poverty, the demographic groups most similar to Immigrants from Croatia are Immigrants from China (7.8%, a difference of 0.14%), Immigrants from Romania (7.8%, a difference of 0.21%), Austrian (7.8%, a difference of 0.21%), Immigrants from Latvia (7.9%, a difference of 0.23%), and Ukrainian (7.9%, a difference of 0.24%).
| Demographics | Rating | Rank | Family Poverty |
| Australians | 98.2 /100 | #68 | Exceptional 7.8% |
| Immigrants | Belgium | 98.2 /100 | #69 | Exceptional 7.8% |
| Immigrants | Canada | 98.2 /100 | #70 | Exceptional 7.8% |
| Cambodians | 98.2 /100 | #71 | Exceptional 7.8% |
| Immigrants | Romania | 98.2 /100 | #72 | Exceptional 7.8% |
| Austrians | 98.2 /100 | #73 | Exceptional 7.8% |
| Immigrants | China | 98.1 /100 | #74 | Exceptional 7.8% |
| Immigrants | Croatia | 98.1 /100 | #75 | Exceptional 7.8% |
| Immigrants | Latvia | 98.0 /100 | #76 | Exceptional 7.9% |
| Ukrainians | 98.0 /100 | #77 | Exceptional 7.9% |
| Immigrants | North America | 97.9 /100 | #78 | Exceptional 7.9% |
| Immigrants | Europe | 97.8 /100 | #79 | Exceptional 7.9% |
| English | 97.8 /100 | #80 | Exceptional 7.9% |
| Irish | 97.8 /100 | #81 | Exceptional 7.9% |
| Immigrants | Poland | 97.8 /100 | #82 | Exceptional 7.9% |
Demographics Similar to Japanese by Family Poverty
In terms of family poverty, the demographic groups most similar to Japanese are Immigrants from Cambodia (9.9%, a difference of 0.030%), Immigrants from Africa (9.9%, a difference of 0.30%), Bermudan (9.9%, a difference of 0.31%), Immigrants from Eritrea (9.9%, a difference of 0.36%), and Panamanian (9.8%, a difference of 0.49%).
| Demographics | Rating | Rank | Family Poverty |
| Immigrants | Nonimmigrants | 6.7 /100 | #215 | Tragic 9.8% |
| Moroccans | 6.5 /100 | #216 | Tragic 9.8% |
| Americans | 6.2 /100 | #217 | Tragic 9.8% |
| Panamanians | 5.6 /100 | #218 | Tragic 9.8% |
| Immigrants | Eritrea | 5.4 /100 | #219 | Tragic 9.9% |
| Bermudans | 5.3 /100 | #220 | Tragic 9.9% |
| Immigrants | Cambodia | 4.8 /100 | #221 | Tragic 9.9% |
| Japanese | 4.8 /100 | #222 | Tragic 9.9% |
| Immigrants | Africa | 4.3 /100 | #223 | Tragic 9.9% |
| Marshallese | 3.9 /100 | #224 | Tragic 9.9% |
| Immigrants | Immigrants | 3.6 /100 | #225 | Tragic 10.0% |
| Ottawa | 3.3 /100 | #226 | Tragic 10.0% |
| Immigrants | Armenia | 3.3 /100 | #227 | Tragic 10.0% |
| Sudanese | 3.1 /100 | #228 | Tragic 10.0% |
| Immigrants | Uzbekistan | 3.1 /100 | #229 | Tragic 10.0% |