Immigrants from Croatia vs Dutch Family Poverty
COMPARE
Immigrants from Croatia
Dutch
Family Poverty
Family Poverty Comparison
Immigrants from Croatia
Dutch
7.8%
FAMILY POVERTY
98.1/ 100
METRIC RATING
75th/ 347
METRIC RANK
7.8%
FAMILY POVERTY
98.3/ 100
METRIC RATING
66th/ 347
METRIC RANK
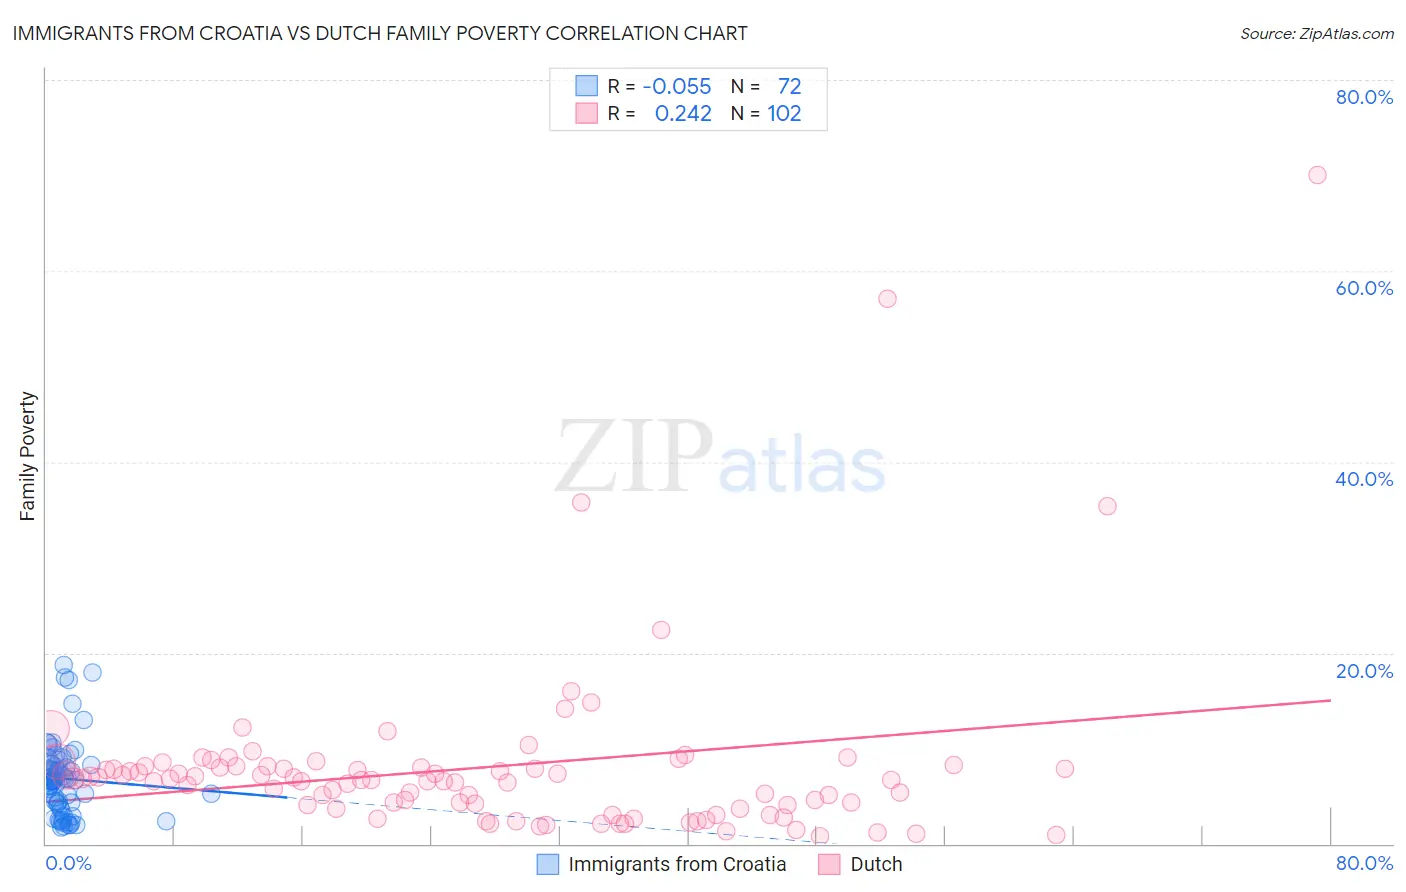
Immigrants from Croatia vs Dutch Family Poverty Correlation Chart
The statistical analysis conducted on geographies consisting of 132,458,844 people shows a slight negative correlation between the proportion of Immigrants from Croatia and poverty level among families in the United States with a correlation coefficient (R) of -0.055 and weighted average of 7.8%. Similarly, the statistical analysis conducted on geographies consisting of 550,370,007 people shows a weak positive correlation between the proportion of Dutch and poverty level among families in the United States with a correlation coefficient (R) of 0.242 and weighted average of 7.8%, a difference of 0.39%.
Family Poverty Correlation Summary
| Measurement | Immigrants from Croatia | Dutch |
| Minimum | 1.7% | 0.79% |
| Maximum | 18.7% | 70.0% |
| Range | 17.0% | 69.2% |
| Mean | 6.8% | 8.0% |
| Median | 6.7% | 6.7% |
| Interquartile 25% (IQ1) | 4.2% | 4.0% |
| Interquartile 75% (IQ3) | 8.2% | 8.1% |
| Interquartile Range (IQR) | 4.0% | 4.1% |
| Standard Deviation (Sample) | 3.9% | 9.6% |
| Standard Deviation (Population) | 3.8% | 9.5% |
Demographics Similar to Immigrants from Croatia and Dutch by Family Poverty
In terms of family poverty, the demographic groups most similar to Immigrants from Croatia are Immigrants from China (7.8%, a difference of 0.14%), Immigrants from Romania (7.8%, a difference of 0.21%), Austrian (7.8%, a difference of 0.21%), Immigrants from Latvia (7.9%, a difference of 0.23%), and Ukrainian (7.9%, a difference of 0.24%). Similarly, the demographic groups most similar to Dutch are Northern European (7.8%, a difference of 0.010%), Australian (7.8%, a difference of 0.040%), Immigrants from Bulgaria (7.8%, a difference of 0.060%), Immigrants from Belgium (7.8%, a difference of 0.060%), and Korean (7.8%, a difference of 0.070%).
| Demographics | Rating | Rank | Family Poverty |
| Immigrants | Greece | 98.7 /100 | #60 | Exceptional 7.7% |
| Immigrants | Netherlands | 98.6 /100 | #61 | Exceptional 7.7% |
| Macedonians | 98.6 /100 | #62 | Exceptional 7.8% |
| Zimbabweans | 98.4 /100 | #63 | Exceptional 7.8% |
| Koreans | 98.3 /100 | #64 | Exceptional 7.8% |
| Immigrants | Bulgaria | 98.3 /100 | #65 | Exceptional 7.8% |
| Dutch | 98.3 /100 | #66 | Exceptional 7.8% |
| Northern Europeans | 98.3 /100 | #67 | Exceptional 7.8% |
| Australians | 98.2 /100 | #68 | Exceptional 7.8% |
| Immigrants | Belgium | 98.2 /100 | #69 | Exceptional 7.8% |
| Immigrants | Canada | 98.2 /100 | #70 | Exceptional 7.8% |
| Cambodians | 98.2 /100 | #71 | Exceptional 7.8% |
| Immigrants | Romania | 98.2 /100 | #72 | Exceptional 7.8% |
| Austrians | 98.2 /100 | #73 | Exceptional 7.8% |
| Immigrants | China | 98.1 /100 | #74 | Exceptional 7.8% |
| Immigrants | Croatia | 98.1 /100 | #75 | Exceptional 7.8% |
| Immigrants | Latvia | 98.0 /100 | #76 | Exceptional 7.9% |
| Ukrainians | 98.0 /100 | #77 | Exceptional 7.9% |
| Immigrants | North America | 97.9 /100 | #78 | Exceptional 7.9% |
| Immigrants | Europe | 97.8 /100 | #79 | Exceptional 7.9% |
| English | 97.8 /100 | #80 | Exceptional 7.9% |