Immigrants from Croatia vs Immigrants from Bulgaria Family Poverty
COMPARE
Immigrants from Croatia
Immigrants from Bulgaria
Family Poverty
Family Poverty Comparison
Immigrants from Croatia
Immigrants from Bulgaria
7.8%
FAMILY POVERTY
98.1/ 100
METRIC RATING
75th/ 347
METRIC RANK
7.8%
FAMILY POVERTY
98.3/ 100
METRIC RATING
65th/ 347
METRIC RANK
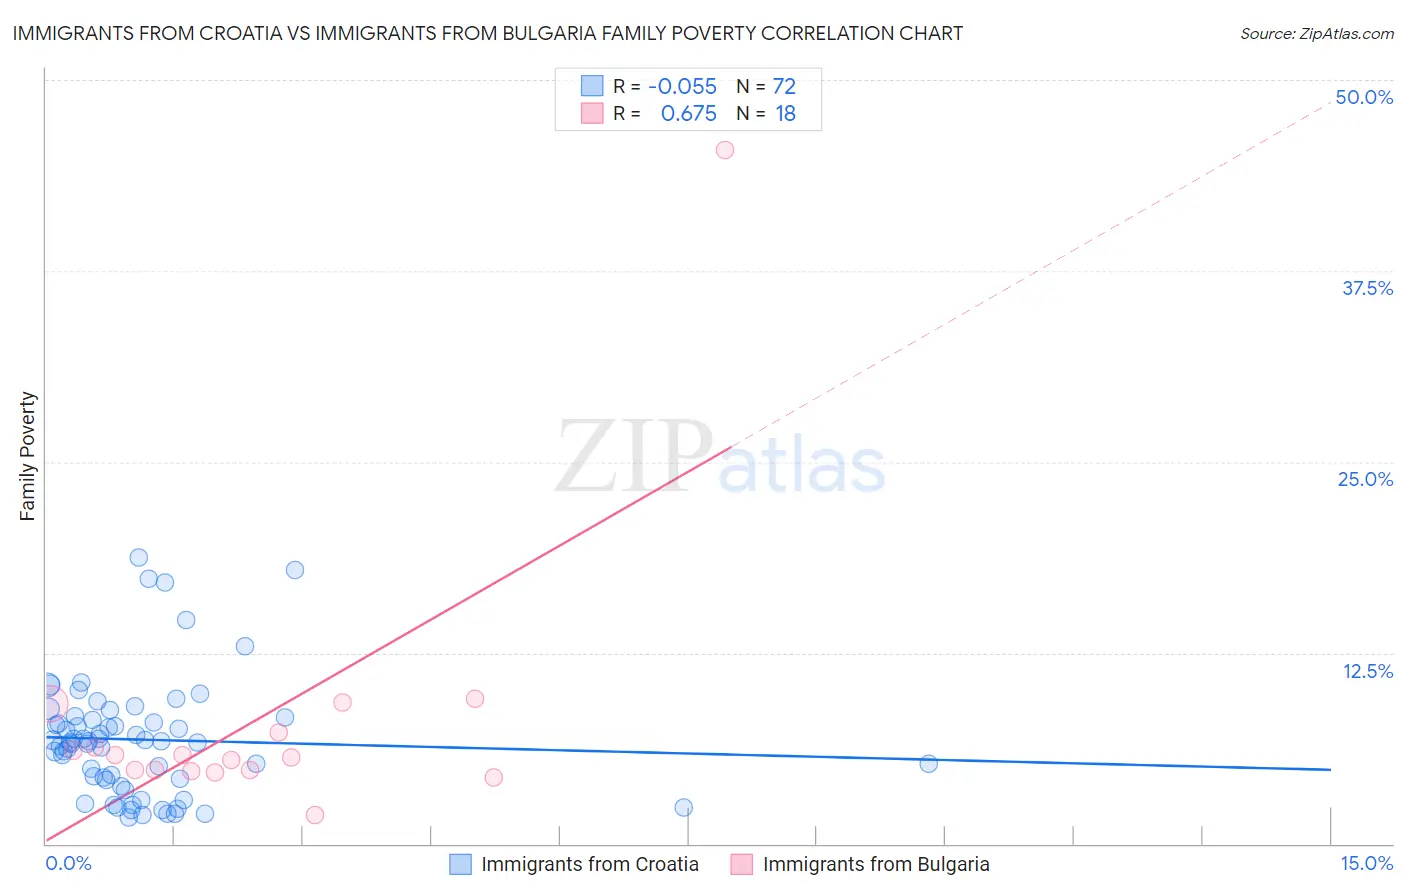
Immigrants from Croatia vs Immigrants from Bulgaria Family Poverty Correlation Chart
The statistical analysis conducted on geographies consisting of 132,458,844 people shows a slight negative correlation between the proportion of Immigrants from Croatia and poverty level among families in the United States with a correlation coefficient (R) of -0.055 and weighted average of 7.8%. Similarly, the statistical analysis conducted on geographies consisting of 172,392,882 people shows a significant positive correlation between the proportion of Immigrants from Bulgaria and poverty level among families in the United States with a correlation coefficient (R) of 0.675 and weighted average of 7.8%, a difference of 0.46%.
Family Poverty Correlation Summary
| Measurement | Immigrants from Croatia | Immigrants from Bulgaria |
| Minimum | 1.7% | 1.9% |
| Maximum | 18.7% | 45.5% |
| Range | 17.0% | 43.6% |
| Mean | 6.8% | 8.1% |
| Median | 6.7% | 5.7% |
| Interquartile 25% (IQ1) | 4.2% | 4.8% |
| Interquartile 75% (IQ3) | 8.2% | 7.3% |
| Interquartile Range (IQR) | 4.0% | 2.5% |
| Standard Deviation (Sample) | 3.9% | 9.5% |
| Standard Deviation (Population) | 3.8% | 9.2% |
Demographics Similar to Immigrants from Croatia and Immigrants from Bulgaria by Family Poverty
In terms of family poverty, the demographic groups most similar to Immigrants from Croatia are Immigrants from China (7.8%, a difference of 0.14%), Immigrants from Romania (7.8%, a difference of 0.21%), Austrian (7.8%, a difference of 0.21%), Immigrants from Latvia (7.9%, a difference of 0.23%), and Ukrainian (7.9%, a difference of 0.24%). Similarly, the demographic groups most similar to Immigrants from Bulgaria are Korean (7.8%, a difference of 0.010%), Dutch (7.8%, a difference of 0.060%), Northern European (7.8%, a difference of 0.070%), Australian (7.8%, a difference of 0.11%), and Immigrants from Belgium (7.8%, a difference of 0.12%).
| Demographics | Rating | Rank | Family Poverty |
| Immigrants | Greece | 98.7 /100 | #60 | Exceptional 7.7% |
| Immigrants | Netherlands | 98.6 /100 | #61 | Exceptional 7.7% |
| Macedonians | 98.6 /100 | #62 | Exceptional 7.8% |
| Zimbabweans | 98.4 /100 | #63 | Exceptional 7.8% |
| Koreans | 98.3 /100 | #64 | Exceptional 7.8% |
| Immigrants | Bulgaria | 98.3 /100 | #65 | Exceptional 7.8% |
| Dutch | 98.3 /100 | #66 | Exceptional 7.8% |
| Northern Europeans | 98.3 /100 | #67 | Exceptional 7.8% |
| Australians | 98.2 /100 | #68 | Exceptional 7.8% |
| Immigrants | Belgium | 98.2 /100 | #69 | Exceptional 7.8% |
| Immigrants | Canada | 98.2 /100 | #70 | Exceptional 7.8% |
| Cambodians | 98.2 /100 | #71 | Exceptional 7.8% |
| Immigrants | Romania | 98.2 /100 | #72 | Exceptional 7.8% |
| Austrians | 98.2 /100 | #73 | Exceptional 7.8% |
| Immigrants | China | 98.1 /100 | #74 | Exceptional 7.8% |
| Immigrants | Croatia | 98.1 /100 | #75 | Exceptional 7.8% |
| Immigrants | Latvia | 98.0 /100 | #76 | Exceptional 7.9% |
| Ukrainians | 98.0 /100 | #77 | Exceptional 7.9% |
| Immigrants | North America | 97.9 /100 | #78 | Exceptional 7.9% |
| Immigrants | Europe | 97.8 /100 | #79 | Exceptional 7.9% |
| English | 97.8 /100 | #80 | Exceptional 7.9% |