Basque vs Russian Poverty
COMPARE
Basque
Russian
Poverty
Poverty Comparison
Basques
Russians
11.9%
POVERTY
80.4/ 100
METRIC RATING
142nd/ 347
METRIC RANK
10.9%
POVERTY
99.3/ 100
METRIC RATING
40th/ 347
METRIC RANK
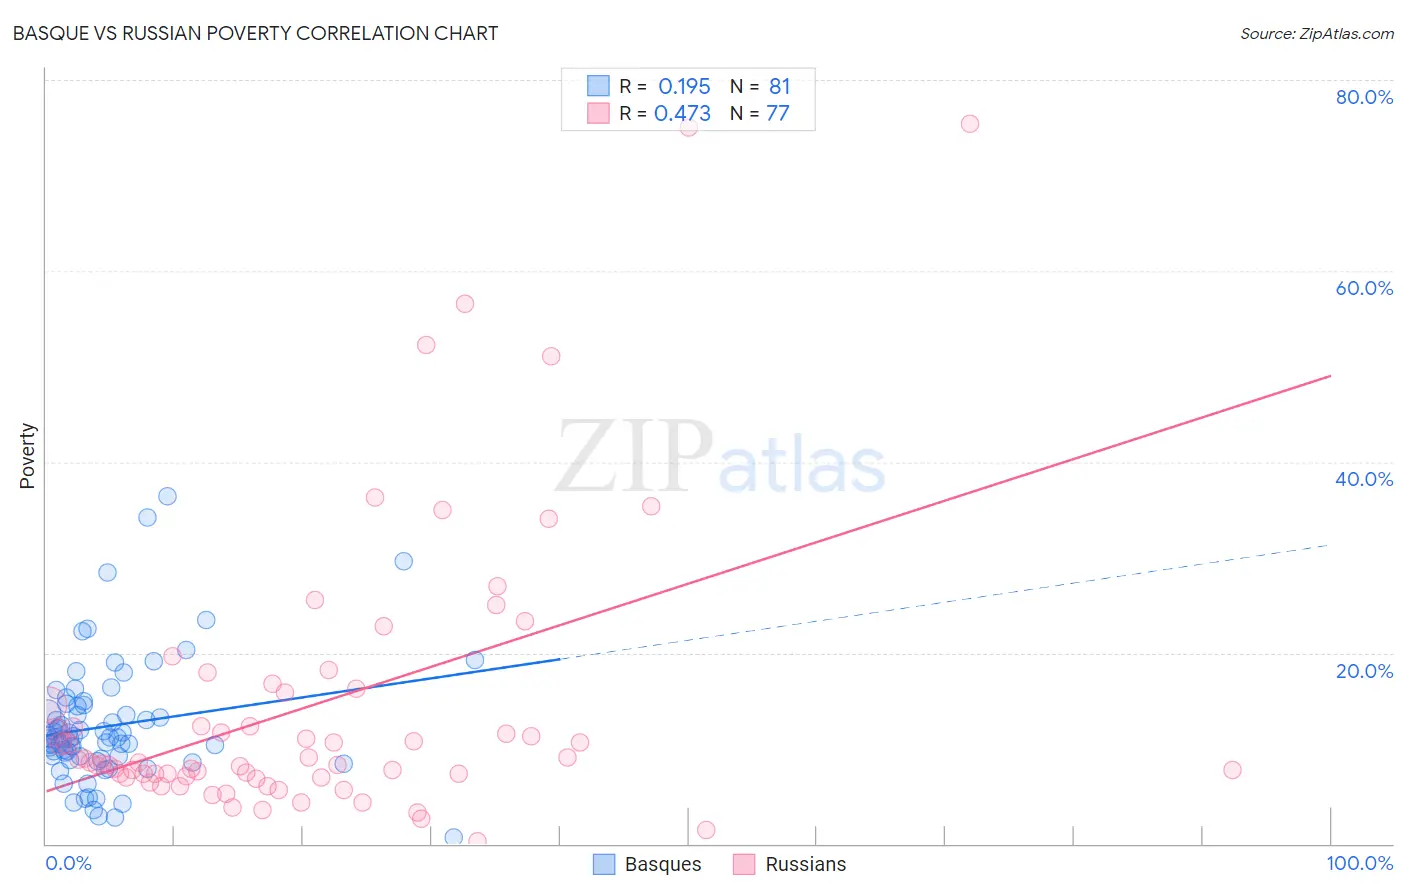
Basque vs Russian Poverty Correlation Chart
The statistical analysis conducted on geographies consisting of 165,732,403 people shows a poor positive correlation between the proportion of Basques and poverty level in the United States with a correlation coefficient (R) of 0.195 and weighted average of 11.9%. Similarly, the statistical analysis conducted on geographies consisting of 511,663,419 people shows a moderate positive correlation between the proportion of Russians and poverty level in the United States with a correlation coefficient (R) of 0.473 and weighted average of 10.9%, a difference of 9.6%.
Poverty Correlation Summary
| Measurement | Basque | Russian |
| Minimum | 0.59% | 0.31% |
| Maximum | 36.5% | 75.4% |
| Range | 35.9% | 75.1% |
| Mean | 12.3% | 14.6% |
| Median | 11.1% | 8.6% |
| Interquartile 25% (IQ1) | 9.0% | 7.0% |
| Interquartile 75% (IQ3) | 14.5% | 16.1% |
| Interquartile Range (IQR) | 5.5% | 9.1% |
| Standard Deviation (Sample) | 6.4% | 15.1% |
| Standard Deviation (Population) | 6.4% | 15.0% |
Similar Demographics by Poverty
Demographics Similar to Basques by Poverty
In terms of poverty, the demographic groups most similar to Basques are Immigrants from France (11.9%, a difference of 0.020%), Immigrants from Peru (11.9%, a difference of 0.11%), Brazilian (11.9%, a difference of 0.11%), Pakistani (11.9%, a difference of 0.30%), and Immigrants from Jordan (11.9%, a difference of 0.32%).
| Demographics | Rating | Rank | Poverty |
| Immigrants | Vietnam | 85.2 /100 | #135 | Excellent 11.8% |
| Chileans | 84.2 /100 | #136 | Excellent 11.8% |
| Immigrants | Switzerland | 83.0 /100 | #137 | Excellent 11.8% |
| Immigrants | Jordan | 82.4 /100 | #138 | Excellent 11.9% |
| Pakistanis | 82.2 /100 | #139 | Excellent 11.9% |
| Immigrants | Peru | 81.1 /100 | #140 | Excellent 11.9% |
| Immigrants | France | 80.5 /100 | #141 | Excellent 11.9% |
| Basques | 80.4 /100 | #142 | Excellent 11.9% |
| Brazilians | 79.7 /100 | #143 | Good 11.9% |
| Icelanders | 77.9 /100 | #144 | Good 11.9% |
| Syrians | 75.1 /100 | #145 | Good 12.0% |
| Afghans | 74.9 /100 | #146 | Good 12.0% |
| Immigrants | Bosnia and Herzegovina | 73.7 /100 | #147 | Good 12.0% |
| Immigrants | Germany | 72.7 /100 | #148 | Good 12.0% |
| Immigrants | Malaysia | 72.7 /100 | #149 | Good 12.0% |
Demographics Similar to Russians by Poverty
In terms of poverty, the demographic groups most similar to Russians are Immigrants from Pakistan (10.8%, a difference of 0.050%), Immigrants from Iran (10.9%, a difference of 0.090%), Czech (10.8%, a difference of 0.13%), Immigrants from Greece (10.8%, a difference of 0.18%), and Cypriot (10.8%, a difference of 0.27%).
| Demographics | Rating | Rank | Poverty |
| Macedonians | 99.4 /100 | #33 | Exceptional 10.8% |
| Immigrants | Poland | 99.4 /100 | #34 | Exceptional 10.8% |
| Tongans | 99.4 /100 | #35 | Exceptional 10.8% |
| Cypriots | 99.3 /100 | #36 | Exceptional 10.8% |
| Immigrants | Greece | 99.3 /100 | #37 | Exceptional 10.8% |
| Czechs | 99.3 /100 | #38 | Exceptional 10.8% |
| Immigrants | Pakistan | 99.3 /100 | #39 | Exceptional 10.8% |
| Russians | 99.3 /100 | #40 | Exceptional 10.9% |
| Immigrants | Iran | 99.2 /100 | #41 | Exceptional 10.9% |
| Koreans | 99.2 /100 | #42 | Exceptional 10.9% |
| Immigrants | Singapore | 99.2 /100 | #43 | Exceptional 10.9% |
| Immigrants | Moldova | 99.1 /100 | #44 | Exceptional 10.9% |
| Turks | 98.9 /100 | #45 | Exceptional 11.0% |
| Immigrants | Czechoslovakia | 98.9 /100 | #46 | Exceptional 11.0% |
| Immigrants | Romania | 98.9 /100 | #47 | Exceptional 11.0% |