Immigrants from Micronesia vs Russian Poverty
COMPARE
Immigrants from Micronesia
Russian
Poverty
Poverty Comparison
Immigrants from Micronesia
Russians
13.4%
POVERTY
2.6/ 100
METRIC RATING
222nd/ 347
METRIC RANK
10.9%
POVERTY
99.3/ 100
METRIC RATING
40th/ 347
METRIC RANK
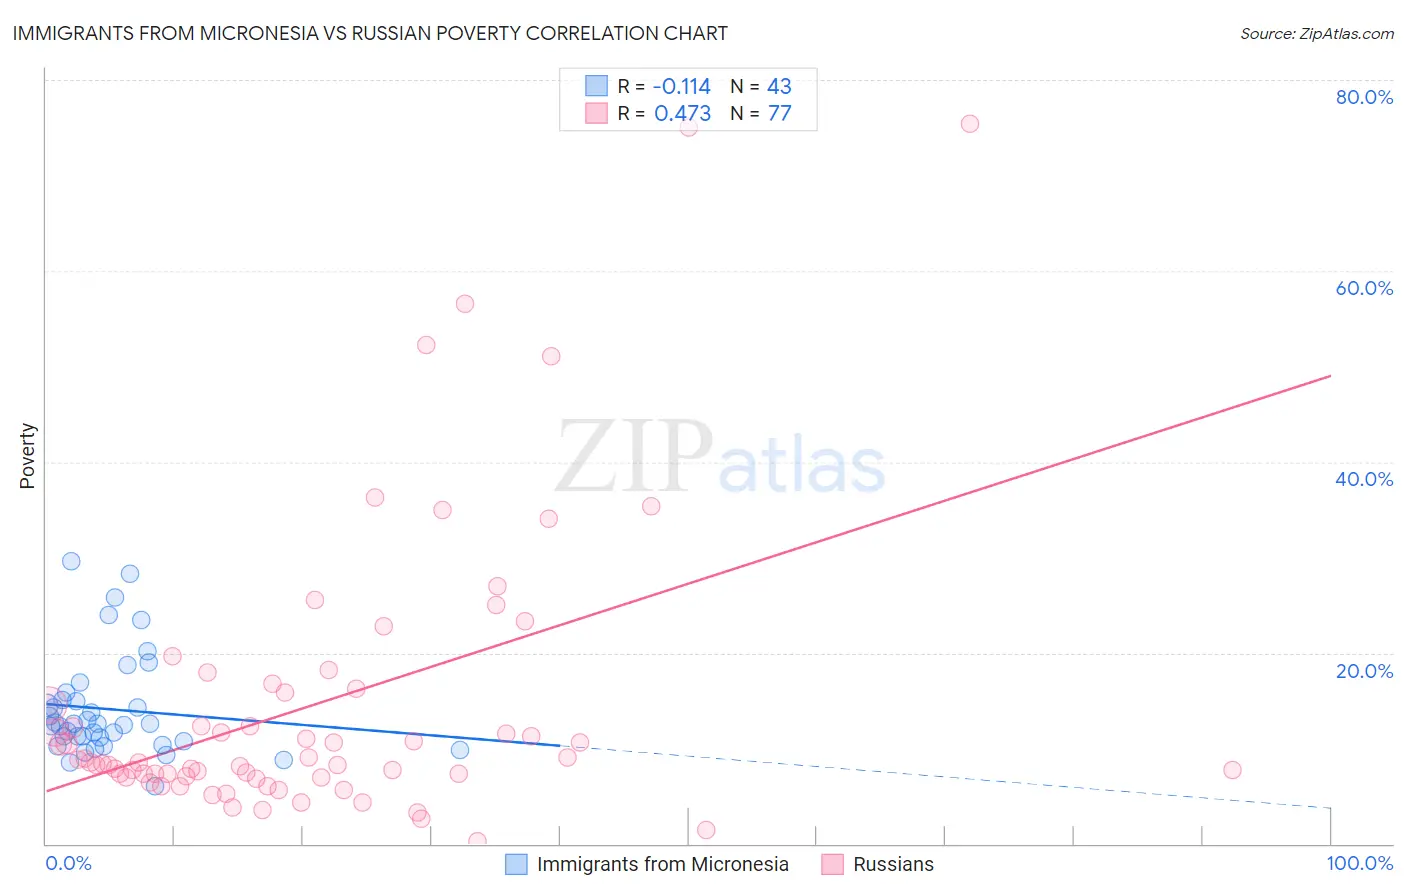
Immigrants from Micronesia vs Russian Poverty Correlation Chart
The statistical analysis conducted on geographies consisting of 61,600,869 people shows a poor negative correlation between the proportion of Immigrants from Micronesia and poverty level in the United States with a correlation coefficient (R) of -0.114 and weighted average of 13.4%. Similarly, the statistical analysis conducted on geographies consisting of 511,663,419 people shows a moderate positive correlation between the proportion of Russians and poverty level in the United States with a correlation coefficient (R) of 0.473 and weighted average of 10.9%, a difference of 23.5%.
Poverty Correlation Summary
| Measurement | Immigrants from Micronesia | Russian |
| Minimum | 6.1% | 0.31% |
| Maximum | 29.6% | 75.4% |
| Range | 23.5% | 75.1% |
| Mean | 14.1% | 14.6% |
| Median | 12.5% | 8.6% |
| Interquartile 25% (IQ1) | 10.7% | 7.0% |
| Interquartile 75% (IQ3) | 15.0% | 16.1% |
| Interquartile Range (IQR) | 4.4% | 9.1% |
| Standard Deviation (Sample) | 5.3% | 15.1% |
| Standard Deviation (Population) | 5.3% | 15.0% |
Similar Demographics by Poverty
Demographics Similar to Immigrants from Micronesia by Poverty
In terms of poverty, the demographic groups most similar to Immigrants from Micronesia are Alsatian (13.4%, a difference of 0.040%), Immigrants from Africa (13.4%, a difference of 0.040%), Immigrants from Eritrea (13.4%, a difference of 0.14%), American (13.4%, a difference of 0.24%), and Immigrants from Cambodia (13.4%, a difference of 0.33%).
| Demographics | Rating | Rank | Poverty |
| Japanese | 3.3 /100 | #215 | Tragic 13.3% |
| Immigrants | Nonimmigrants | 3.3 /100 | #216 | Tragic 13.3% |
| Immigrants | Uzbekistan | 3.2 /100 | #217 | Tragic 13.3% |
| Immigrants | Thailand | 3.1 /100 | #218 | Tragic 13.3% |
| Immigrants | Cambodia | 3.0 /100 | #219 | Tragic 13.4% |
| Americans | 2.9 /100 | #220 | Tragic 13.4% |
| Alsatians | 2.6 /100 | #221 | Tragic 13.4% |
| Immigrants | Micronesia | 2.6 /100 | #222 | Tragic 13.4% |
| Immigrants | Africa | 2.5 /100 | #223 | Tragic 13.4% |
| Immigrants | Eritrea | 2.4 /100 | #224 | Tragic 13.4% |
| German Russians | 2.2 /100 | #225 | Tragic 13.4% |
| Marshallese | 2.2 /100 | #226 | Tragic 13.4% |
| Alaska Natives | 2.1 /100 | #227 | Tragic 13.5% |
| Immigrants | Nigeria | 1.7 /100 | #228 | Tragic 13.5% |
| Osage | 1.5 /100 | #229 | Tragic 13.6% |
Demographics Similar to Russians by Poverty
In terms of poverty, the demographic groups most similar to Russians are Immigrants from Pakistan (10.8%, a difference of 0.050%), Immigrants from Iran (10.9%, a difference of 0.090%), Czech (10.8%, a difference of 0.13%), Immigrants from Greece (10.8%, a difference of 0.18%), and Cypriot (10.8%, a difference of 0.27%).
| Demographics | Rating | Rank | Poverty |
| Macedonians | 99.4 /100 | #33 | Exceptional 10.8% |
| Immigrants | Poland | 99.4 /100 | #34 | Exceptional 10.8% |
| Tongans | 99.4 /100 | #35 | Exceptional 10.8% |
| Cypriots | 99.3 /100 | #36 | Exceptional 10.8% |
| Immigrants | Greece | 99.3 /100 | #37 | Exceptional 10.8% |
| Czechs | 99.3 /100 | #38 | Exceptional 10.8% |
| Immigrants | Pakistan | 99.3 /100 | #39 | Exceptional 10.8% |
| Russians | 99.3 /100 | #40 | Exceptional 10.9% |
| Immigrants | Iran | 99.2 /100 | #41 | Exceptional 10.9% |
| Koreans | 99.2 /100 | #42 | Exceptional 10.9% |
| Immigrants | Singapore | 99.2 /100 | #43 | Exceptional 10.9% |
| Immigrants | Moldova | 99.1 /100 | #44 | Exceptional 10.9% |
| Turks | 98.9 /100 | #45 | Exceptional 11.0% |
| Immigrants | Czechoslovakia | 98.9 /100 | #46 | Exceptional 11.0% |
| Immigrants | Romania | 98.9 /100 | #47 | Exceptional 11.0% |