Immigrants from China vs Albanian Single Female Poverty
COMPARE
Immigrants from China
Albanian
Single Female Poverty
Single Female Poverty Comparison
Immigrants from China
Albanians
18.1%
SINGLE FEMALE POVERTY
100.0/ 100
METRIC RATING
19th/ 347
METRIC RANK
19.4%
SINGLE FEMALE POVERTY
99.3/ 100
METRIC RATING
78th/ 347
METRIC RANK
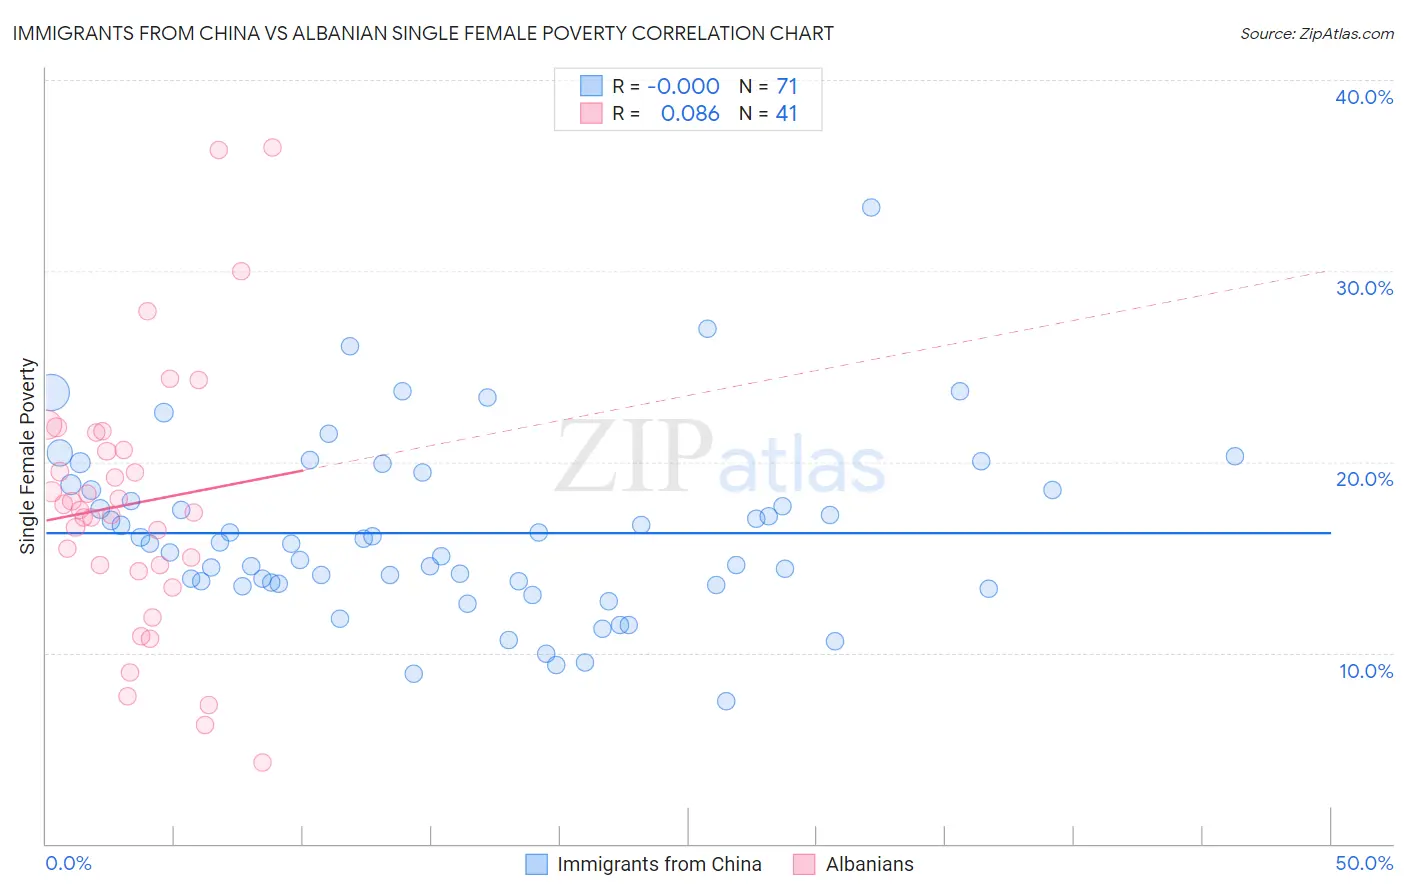
Immigrants from China vs Albanian Single Female Poverty Correlation Chart
The statistical analysis conducted on geographies consisting of 446,922,860 people shows no correlation between the proportion of Immigrants from China and poverty level among single females in the United States with a correlation coefficient (R) of -0.000 and weighted average of 18.1%. Similarly, the statistical analysis conducted on geographies consisting of 190,945,474 people shows a slight positive correlation between the proportion of Albanians and poverty level among single females in the United States with a correlation coefficient (R) of 0.086 and weighted average of 19.4%, a difference of 6.9%.
Single Female Poverty Correlation Summary
| Measurement | Immigrants from China | Albanian |
| Minimum | 7.4% | 4.3% |
| Maximum | 33.3% | 36.5% |
| Range | 25.9% | 32.2% |
| Mean | 16.3% | 17.8% |
| Median | 15.7% | 17.5% |
| Interquartile 25% (IQ1) | 13.6% | 14.4% |
| Interquartile 75% (IQ3) | 18.6% | 21.1% |
| Interquartile Range (IQR) | 4.9% | 6.7% |
| Standard Deviation (Sample) | 4.6% | 6.9% |
| Standard Deviation (Population) | 4.5% | 6.9% |
Similar Demographics by Single Female Poverty
Demographics Similar to Immigrants from China by Single Female Poverty
In terms of single female poverty, the demographic groups most similar to Immigrants from China are Immigrants from Eastern Asia (18.1%, a difference of 0.030%), Immigrants from Korea (18.1%, a difference of 0.32%), Immigrants from Greece (18.3%, a difference of 0.68%), Maltese (18.3%, a difference of 0.74%), and Burmese (18.3%, a difference of 0.75%).
| Demographics | Rating | Rank | Single Female Poverty |
| Immigrants | South Central Asia | 100.0 /100 | #12 | Exceptional 17.8% |
| Immigrants | Bolivia | 100.0 /100 | #13 | Exceptional 17.8% |
| Bolivians | 100.0 /100 | #14 | Exceptional 17.9% |
| Indians (Asian) | 100.0 /100 | #15 | Exceptional 17.9% |
| Iranians | 100.0 /100 | #16 | Exceptional 18.0% |
| Immigrants | Korea | 100.0 /100 | #17 | Exceptional 18.1% |
| Immigrants | Eastern Asia | 100.0 /100 | #18 | Exceptional 18.1% |
| Immigrants | China | 100.0 /100 | #19 | Exceptional 18.1% |
| Immigrants | Greece | 100.0 /100 | #20 | Exceptional 18.3% |
| Maltese | 100.0 /100 | #21 | Exceptional 18.3% |
| Burmese | 100.0 /100 | #22 | Exceptional 18.3% |
| Asians | 100.0 /100 | #23 | Exceptional 18.3% |
| Armenians | 100.0 /100 | #24 | Exceptional 18.3% |
| Immigrants | Singapore | 100.0 /100 | #25 | Exceptional 18.3% |
| Immigrants | Israel | 100.0 /100 | #26 | Exceptional 18.3% |
Demographics Similar to Albanians by Single Female Poverty
In terms of single female poverty, the demographic groups most similar to Albanians are Immigrants from Sierra Leone (19.4%, a difference of 0.020%), Immigrants from Australia (19.4%, a difference of 0.060%), Immigrants from Russia (19.4%, a difference of 0.070%), Immigrants from Scotland (19.4%, a difference of 0.080%), and Immigrants from Malaysia (19.4%, a difference of 0.090%).
| Demographics | Rating | Rank | Single Female Poverty |
| Immigrants | South Eastern Asia | 99.4 /100 | #71 | Exceptional 19.3% |
| Immigrants | Latvia | 99.4 /100 | #72 | Exceptional 19.3% |
| Immigrants | Peru | 99.4 /100 | #73 | Exceptional 19.3% |
| Immigrants | Belarus | 99.4 /100 | #74 | Exceptional 19.3% |
| Immigrants | Turkey | 99.4 /100 | #75 | Exceptional 19.4% |
| Peruvians | 99.4 /100 | #76 | Exceptional 19.4% |
| Immigrants | Russia | 99.3 /100 | #77 | Exceptional 19.4% |
| Albanians | 99.3 /100 | #78 | Exceptional 19.4% |
| Immigrants | Sierra Leone | 99.3 /100 | #79 | Exceptional 19.4% |
| Immigrants | Australia | 99.3 /100 | #80 | Exceptional 19.4% |
| Immigrants | Scotland | 99.2 /100 | #81 | Exceptional 19.4% |
| Immigrants | Malaysia | 99.2 /100 | #82 | Exceptional 19.4% |
| Taiwanese | 99.2 /100 | #83 | Exceptional 19.4% |
| Immigrants | Sweden | 99.2 /100 | #84 | Exceptional 19.4% |
| Immigrants | Albania | 99.2 /100 | #85 | Exceptional 19.4% |