Immigrants from China vs Albanian 10th Grade
COMPARE
Immigrants from China
Albanian
10th Grade
10th Grade Comparison
Immigrants from China
Albanians
93.2%
10TH GRADE
5.9/ 100
METRIC RATING
228th/ 347
METRIC RANK
94.1%
10TH GRADE
86.5/ 100
METRIC RATING
142nd/ 347
METRIC RANK
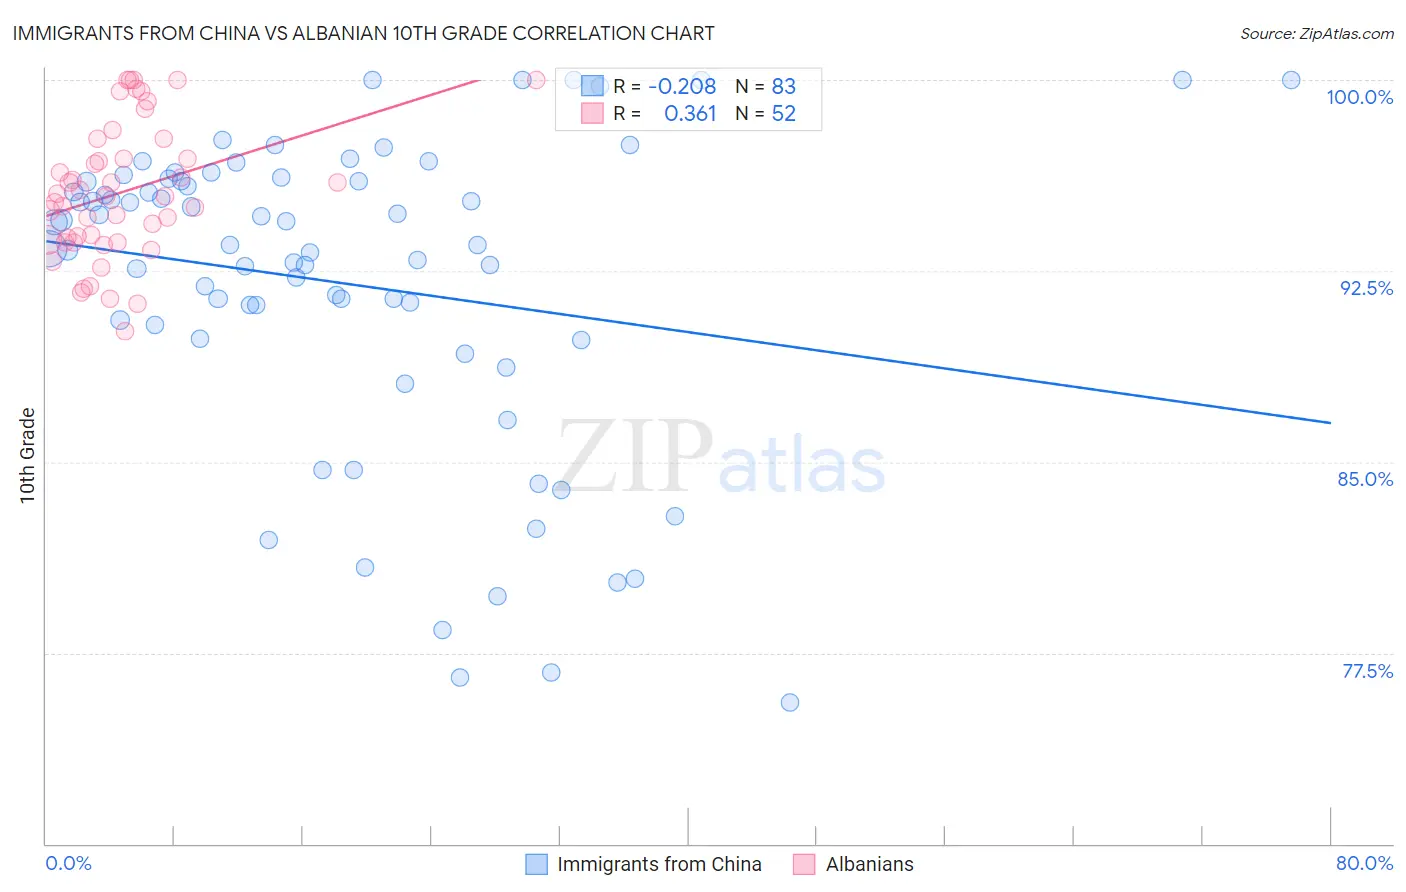
Immigrants from China vs Albanian 10th Grade Correlation Chart
The statistical analysis conducted on geographies consisting of 457,082,957 people shows a weak negative correlation between the proportion of Immigrants from China and percentage of population with at least 10th grade education in the United States with a correlation coefficient (R) of -0.208 and weighted average of 93.2%. Similarly, the statistical analysis conducted on geographies consisting of 193,265,850 people shows a mild positive correlation between the proportion of Albanians and percentage of population with at least 10th grade education in the United States with a correlation coefficient (R) of 0.361 and weighted average of 94.1%, a difference of 1.0%.
10th Grade Correlation Summary
| Measurement | Immigrants from China | Albanian |
| Minimum | 75.5% | 90.1% |
| Maximum | 100.0% | 100.0% |
| Range | 24.5% | 9.9% |
| Mean | 92.0% | 95.6% |
| Median | 93.5% | 95.4% |
| Interquartile 25% (IQ1) | 89.9% | 93.7% |
| Interquartile 75% (IQ3) | 96.0% | 97.3% |
| Interquartile Range (IQR) | 6.2% | 3.6% |
| Standard Deviation (Sample) | 6.1% | 2.6% |
| Standard Deviation (Population) | 6.1% | 2.6% |
Similar Demographics by 10th Grade
Demographics Similar to Immigrants from China by 10th Grade
In terms of 10th grade, the demographic groups most similar to Immigrants from China are Somali (93.2%, a difference of 0.010%), Korean (93.2%, a difference of 0.010%), Black/African American (93.2%, a difference of 0.010%), Bolivian (93.2%, a difference of 0.030%), and Immigrants from Ethiopia (93.1%, a difference of 0.030%).
| Demographics | Rating | Rank | 10th Grade |
| Immigrants | Southern Europe | 8.9 /100 | #221 | Tragic 93.2% |
| Ethiopians | 7.9 /100 | #222 | Tragic 93.2% |
| Immigrants | Sierra Leone | 7.6 /100 | #223 | Tragic 93.2% |
| Bolivians | 6.7 /100 | #224 | Tragic 93.2% |
| Somalis | 6.2 /100 | #225 | Tragic 93.2% |
| Koreans | 6.1 /100 | #226 | Tragic 93.2% |
| Blacks/African Americans | 6.0 /100 | #227 | Tragic 93.2% |
| Immigrants | China | 5.9 /100 | #228 | Tragic 93.2% |
| Immigrants | Ethiopia | 5.1 /100 | #229 | Tragic 93.1% |
| Immigrants | Africa | 5.0 /100 | #230 | Tragic 93.1% |
| South American Indians | 4.9 /100 | #231 | Tragic 93.1% |
| Bahamians | 4.9 /100 | #232 | Tragic 93.1% |
| Comanche | 4.9 /100 | #233 | Tragic 93.1% |
| Sub-Saharan Africans | 4.7 /100 | #234 | Tragic 93.1% |
| Africans | 4.6 /100 | #235 | Tragic 93.1% |
Demographics Similar to Albanians by 10th Grade
In terms of 10th grade, the demographic groups most similar to Albanians are Hmong (94.1%, a difference of 0.0%), Immigrants from Jordan (94.1%, a difference of 0.020%), Cherokee (94.1%, a difference of 0.030%), Immigrants from Kazakhstan (94.1%, a difference of 0.030%), and Nonimmigrants (94.1%, a difference of 0.050%).
| Demographics | Rating | Rank | 10th Grade |
| Immigrants | Korea | 91.3 /100 | #135 | Exceptional 94.2% |
| Shoshone | 90.8 /100 | #136 | Exceptional 94.2% |
| Arapaho | 90.5 /100 | #137 | Exceptional 94.2% |
| Immigrants | Sri Lanka | 89.9 /100 | #138 | Excellent 94.2% |
| Immigrants | Bosnia and Herzegovina | 89.4 /100 | #139 | Excellent 94.2% |
| Immigrants | Jordan | 87.6 /100 | #140 | Excellent 94.1% |
| Hmong | 86.6 /100 | #141 | Excellent 94.1% |
| Albanians | 86.5 /100 | #142 | Excellent 94.1% |
| Cherokee | 84.9 /100 | #143 | Excellent 94.1% |
| Immigrants | Kazakhstan | 84.9 /100 | #144 | Excellent 94.1% |
| Immigrants | Nonimmigrants | 83.8 /100 | #145 | Excellent 94.1% |
| Chickasaw | 82.6 /100 | #146 | Excellent 94.1% |
| Immigrants | Ukraine | 81.5 /100 | #147 | Excellent 94.0% |
| Arabs | 80.9 /100 | #148 | Excellent 94.0% |
| Ugandans | 80.7 /100 | #149 | Excellent 94.0% |