Immigrants from Caribbean vs Eastern European Married-Couple Family Poverty
COMPARE
Immigrants from Caribbean
Eastern European
Married-Couple Family Poverty
Married-Couple Family Poverty Comparison
Immigrants from Caribbean
Eastern Europeans
7.3%
MARRIED-COUPLE FAMILY POVERTY
0.0/ 100
METRIC RATING
321st/ 347
METRIC RANK
4.1%
MARRIED-COUPLE FAMILY POVERTY
99.9/ 100
METRIC RATING
24th/ 347
METRIC RANK
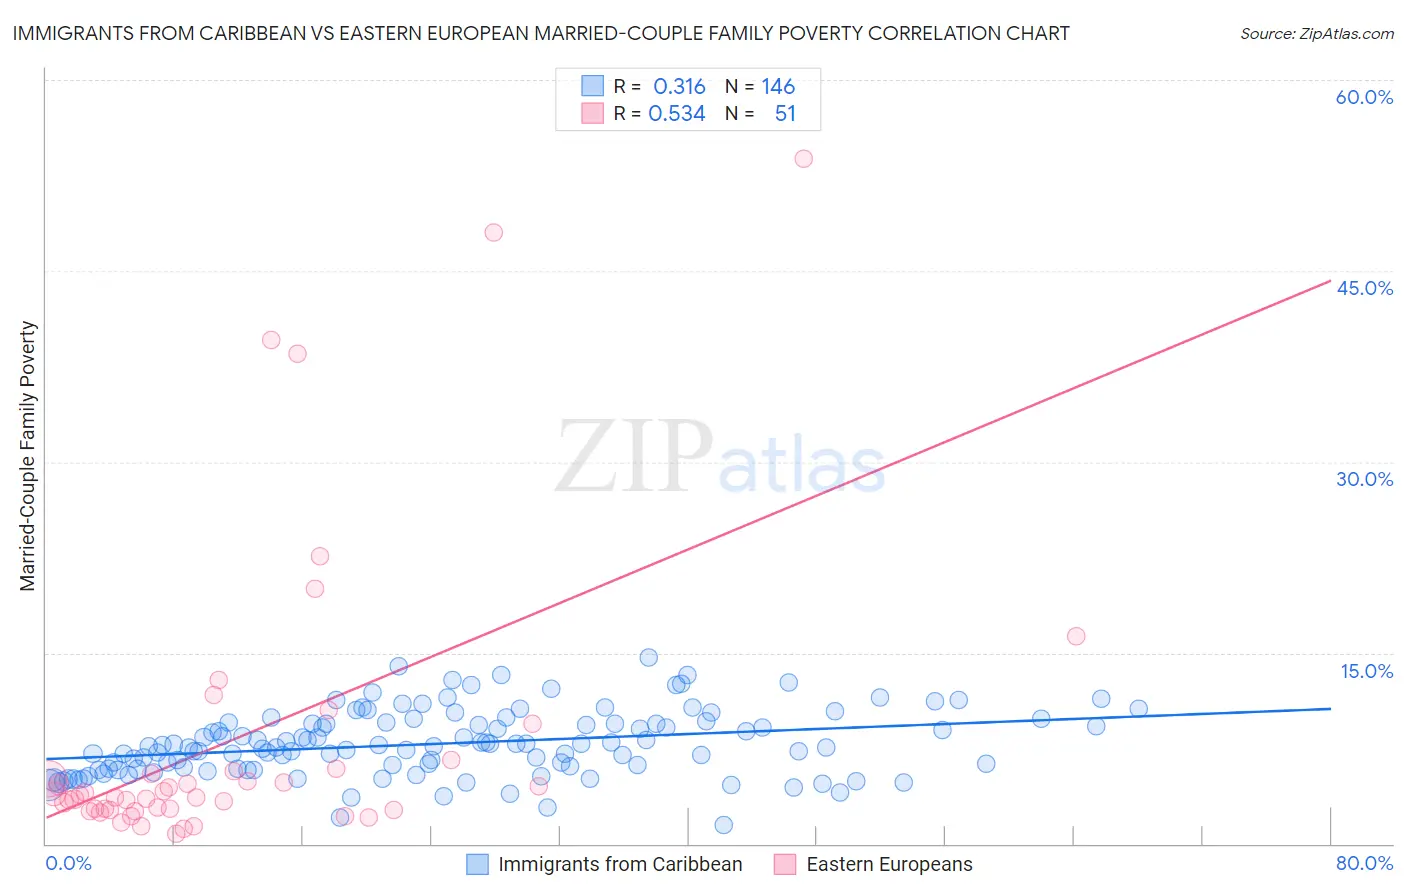
Immigrants from Caribbean vs Eastern European Married-Couple Family Poverty Correlation Chart
The statistical analysis conducted on geographies consisting of 444,708,318 people shows a mild positive correlation between the proportion of Immigrants from Caribbean and poverty level among married-couple families in the United States with a correlation coefficient (R) of 0.316 and weighted average of 7.3%. Similarly, the statistical analysis conducted on geographies consisting of 454,266,648 people shows a substantial positive correlation between the proportion of Eastern Europeans and poverty level among married-couple families in the United States with a correlation coefficient (R) of 0.534 and weighted average of 4.1%, a difference of 78.9%.
Married-Couple Family Poverty Correlation Summary
| Measurement | Immigrants from Caribbean | Eastern European |
| Minimum | 1.5% | 0.83% |
| Maximum | 14.6% | 53.8% |
| Range | 13.1% | 53.0% |
| Mean | 7.9% | 8.3% |
| Median | 7.7% | 3.8% |
| Interquartile 25% (IQ1) | 5.9% | 2.7% |
| Interquartile 75% (IQ3) | 9.4% | 5.9% |
| Interquartile Range (IQR) | 3.5% | 3.2% |
| Standard Deviation (Sample) | 2.5% | 11.8% |
| Standard Deviation (Population) | 2.5% | 11.7% |
Similar Demographics by Married-Couple Family Poverty
Demographics Similar to Immigrants from Caribbean by Married-Couple Family Poverty
In terms of married-couple family poverty, the demographic groups most similar to Immigrants from Caribbean are Immigrants from Honduras (7.3%, a difference of 0.030%), Immigrants from Grenada (7.3%, a difference of 0.77%), Vietnamese (7.4%, a difference of 1.1%), Immigrants from Central America (7.4%, a difference of 1.2%), and Immigrants from Cuba (7.5%, a difference of 1.7%).
| Demographics | Rating | Rank | Married-Couple Family Poverty |
| British West Indians | 0.0 /100 | #314 | Tragic 7.1% |
| Inupiat | 0.0 /100 | #315 | Tragic 7.1% |
| Hondurans | 0.0 /100 | #316 | Tragic 7.2% |
| Mexicans | 0.0 /100 | #317 | Tragic 7.2% |
| Immigrants | Guatemala | 0.0 /100 | #318 | Tragic 7.2% |
| Immigrants | Latin America | 0.0 /100 | #319 | Tragic 7.2% |
| Immigrants | Grenada | 0.0 /100 | #320 | Tragic 7.3% |
| Immigrants | Caribbean | 0.0 /100 | #321 | Tragic 7.3% |
| Immigrants | Honduras | 0.0 /100 | #322 | Tragic 7.3% |
| Vietnamese | 0.0 /100 | #323 | Tragic 7.4% |
| Immigrants | Central America | 0.0 /100 | #324 | Tragic 7.4% |
| Immigrants | Cuba | 0.0 /100 | #325 | Tragic 7.5% |
| Immigrants | Bangladesh | 0.0 /100 | #326 | Tragic 7.5% |
| Hispanics or Latinos | 0.0 /100 | #327 | Tragic 7.5% |
| Immigrants | Mexico | 0.0 /100 | #328 | Tragic 7.6% |
Demographics Similar to Eastern Europeans by Married-Couple Family Poverty
In terms of married-couple family poverty, the demographic groups most similar to Eastern Europeans are Bhutanese (4.1%, a difference of 0.23%), Immigrants from Singapore (4.1%, a difference of 0.26%), Immigrants from Taiwan (4.1%, a difference of 0.57%), Zimbabwean (4.1%, a difference of 0.62%), and Maltese (4.1%, a difference of 0.65%).
| Demographics | Rating | Rank | Married-Couple Family Poverty |
| Filipinos | 100.0 /100 | #17 | Exceptional 4.0% |
| Italians | 100.0 /100 | #18 | Exceptional 4.0% |
| Immigrants | Ireland | 99.9 /100 | #19 | Exceptional 4.1% |
| Maltese | 99.9 /100 | #20 | Exceptional 4.1% |
| Zimbabweans | 99.9 /100 | #21 | Exceptional 4.1% |
| Immigrants | Singapore | 99.9 /100 | #22 | Exceptional 4.1% |
| Bhutanese | 99.9 /100 | #23 | Exceptional 4.1% |
| Eastern Europeans | 99.9 /100 | #24 | Exceptional 4.1% |
| Immigrants | Taiwan | 99.9 /100 | #25 | Exceptional 4.1% |
| Cypriots | 99.9 /100 | #26 | Exceptional 4.1% |
| Danes | 99.9 /100 | #27 | Exceptional 4.1% |
| Scandinavians | 99.9 /100 | #28 | Exceptional 4.1% |
| Immigrants | Scotland | 99.9 /100 | #29 | Exceptional 4.2% |
| Finns | 99.9 /100 | #30 | Exceptional 4.2% |
| Estonians | 99.9 /100 | #31 | Exceptional 4.2% |