Immigrants from Caribbean vs Bolivian In Labor Force | Age 16-19
COMPARE
Immigrants from Caribbean
Bolivian
In Labor Force | Age 16-19
In Labor Force | Age 16-19 Comparison
Immigrants from Caribbean
Bolivians
31.2%
IN LABOR FORCE | AGE 16-19
0.0/ 100
METRIC RATING
323rd/ 347
METRIC RANK
36.0%
IN LABOR FORCE | AGE 16-19
23.3/ 100
METRIC RATING
195th/ 347
METRIC RANK
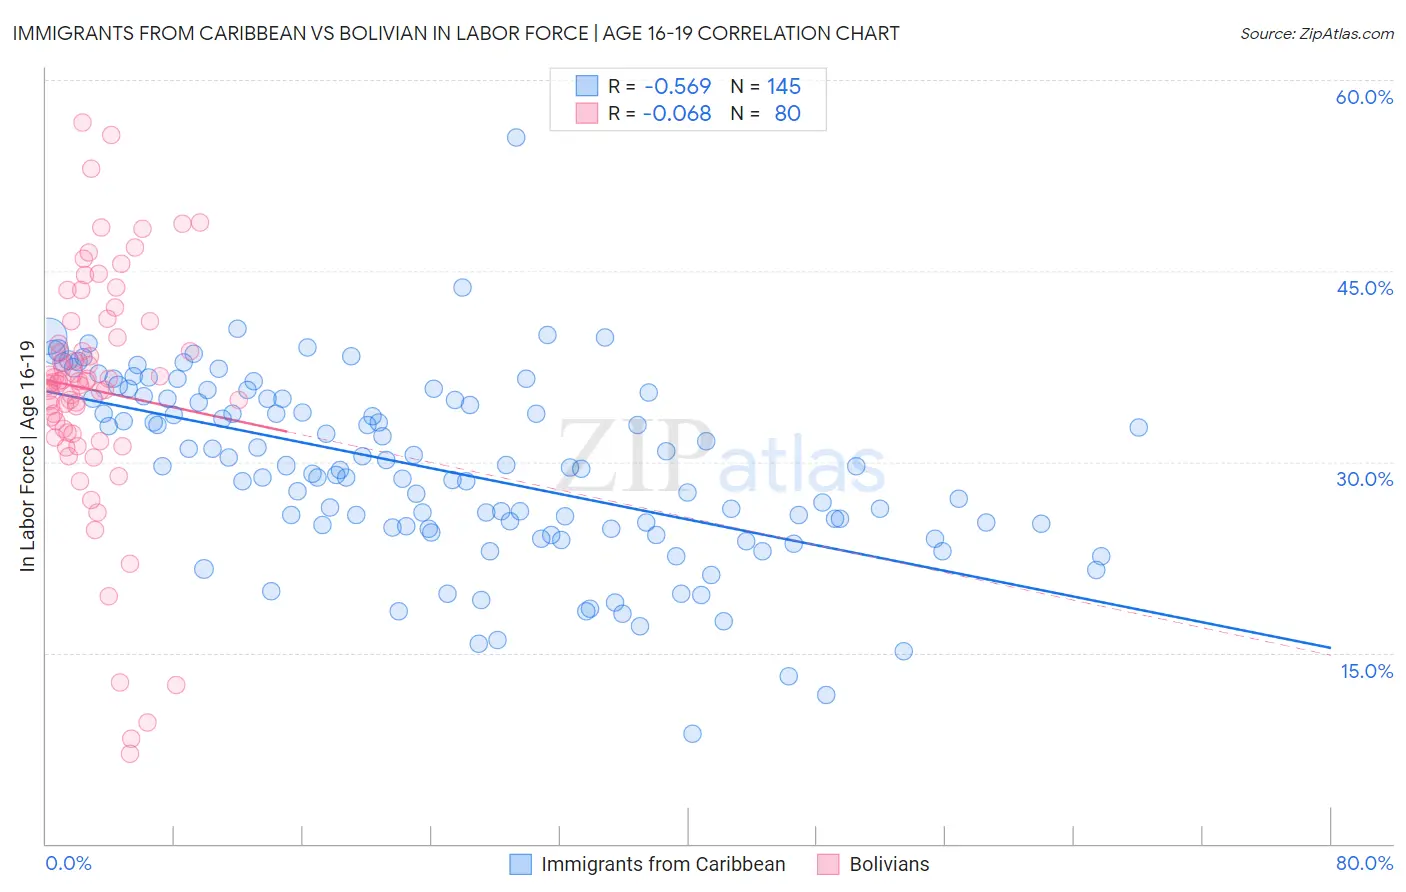
Immigrants from Caribbean vs Bolivian In Labor Force | Age 16-19 Correlation Chart
The statistical analysis conducted on geographies consisting of 448,967,505 people shows a substantial negative correlation between the proportion of Immigrants from Caribbean and labor force participation rate among population between the ages 16 and 19 in the United States with a correlation coefficient (R) of -0.569 and weighted average of 31.2%. Similarly, the statistical analysis conducted on geographies consisting of 184,559,639 people shows a slight negative correlation between the proportion of Bolivians and labor force participation rate among population between the ages 16 and 19 in the United States with a correlation coefficient (R) of -0.068 and weighted average of 36.0%, a difference of 15.3%.
In Labor Force | Age 16-19 Correlation Summary
| Measurement | Immigrants from Caribbean | Bolivian |
| Minimum | 8.6% | 7.1% |
| Maximum | 55.5% | 56.7% |
| Range | 46.9% | 49.6% |
| Mean | 29.4% | 35.6% |
| Median | 29.6% | 36.3% |
| Interquartile 25% (IQ1) | 24.8% | 32.3% |
| Interquartile 75% (IQ3) | 35.0% | 40.4% |
| Interquartile Range (IQR) | 10.1% | 8.1% |
| Standard Deviation (Sample) | 7.2% | 9.5% |
| Standard Deviation (Population) | 7.2% | 9.5% |
Similar Demographics by In Labor Force | Age 16-19
Demographics Similar to Immigrants from Caribbean by In Labor Force | Age 16-19
In terms of in labor force | age 16-19, the demographic groups most similar to Immigrants from Caribbean are Tohono O'odham (31.3%, a difference of 0.13%), Dominican (31.2%, a difference of 0.18%), West Indian (31.3%, a difference of 0.25%), Immigrants from China (31.1%, a difference of 0.33%), and Ecuadorian (31.4%, a difference of 0.48%).
| Demographics | Rating | Rank | In Labor Force | Age 16-19 |
| Filipinos | 0.0 /100 | #316 | Tragic 31.7% |
| Immigrants | Nicaragua | 0.0 /100 | #317 | Tragic 31.6% |
| Immigrants | Yemen | 0.0 /100 | #318 | Tragic 31.5% |
| Soviet Union | 0.0 /100 | #319 | Tragic 31.4% |
| Ecuadorians | 0.0 /100 | #320 | Tragic 31.4% |
| West Indians | 0.0 /100 | #321 | Tragic 31.3% |
| Tohono O'odham | 0.0 /100 | #322 | Tragic 31.3% |
| Immigrants | Caribbean | 0.0 /100 | #323 | Tragic 31.2% |
| Dominicans | 0.0 /100 | #324 | Tragic 31.2% |
| Immigrants | China | 0.0 /100 | #325 | Tragic 31.1% |
| Immigrants | Dominican Republic | 0.0 /100 | #326 | Tragic 31.1% |
| Immigrants | Taiwan | 0.0 /100 | #327 | Tragic 31.0% |
| Immigrants | Ecuador | 0.0 /100 | #328 | Tragic 31.0% |
| Barbadians | 0.0 /100 | #329 | Tragic 31.0% |
| Lumbee | 0.0 /100 | #330 | Tragic 31.0% |
Demographics Similar to Bolivians by In Labor Force | Age 16-19
In terms of in labor force | age 16-19, the demographic groups most similar to Bolivians are Nigerian (36.1%, a difference of 0.090%), Immigrants from Denmark (36.1%, a difference of 0.12%), Afghan (36.1%, a difference of 0.16%), Mexican American Indian (36.0%, a difference of 0.16%), and Immigrants from Serbia (36.0%, a difference of 0.17%).
| Demographics | Rating | Rank | In Labor Force | Age 16-19 |
| Immigrants | Europe | 31.8 /100 | #188 | Fair 36.2% |
| Immigrants | Hungary | 28.8 /100 | #189 | Fair 36.2% |
| Panamanians | 28.6 /100 | #190 | Fair 36.1% |
| Immigrants | Croatia | 27.5 /100 | #191 | Fair 36.1% |
| Afghans | 25.7 /100 | #192 | Fair 36.1% |
| Immigrants | Denmark | 25.0 /100 | #193 | Fair 36.1% |
| Nigerians | 24.6 /100 | #194 | Fair 36.1% |
| Bolivians | 23.3 /100 | #195 | Fair 36.0% |
| Mexican American Indians | 21.1 /100 | #196 | Fair 36.0% |
| Immigrants | Serbia | 21.0 /100 | #197 | Fair 36.0% |
| Immigrants | Northern Africa | 19.9 /100 | #198 | Poor 35.9% |
| Immigrants | Norway | 19.8 /100 | #199 | Poor 35.9% |
| Immigrants | Sweden | 18.8 /100 | #200 | Poor 35.9% |
| Alsatians | 17.5 /100 | #201 | Poor 35.9% |
| Senegalese | 17.4 /100 | #202 | Poor 35.9% |