Immigrants from Caribbean vs Bolivian Single Male Poverty
COMPARE
Immigrants from Caribbean
Bolivian
Single Male Poverty
Single Male Poverty Comparison
Immigrants from Caribbean
Bolivians
13.3%
SINGLE MALE POVERTY
5.0/ 100
METRIC RATING
232nd/ 347
METRIC RANK
11.2%
SINGLE MALE POVERTY
100.0/ 100
METRIC RATING
23rd/ 347
METRIC RANK
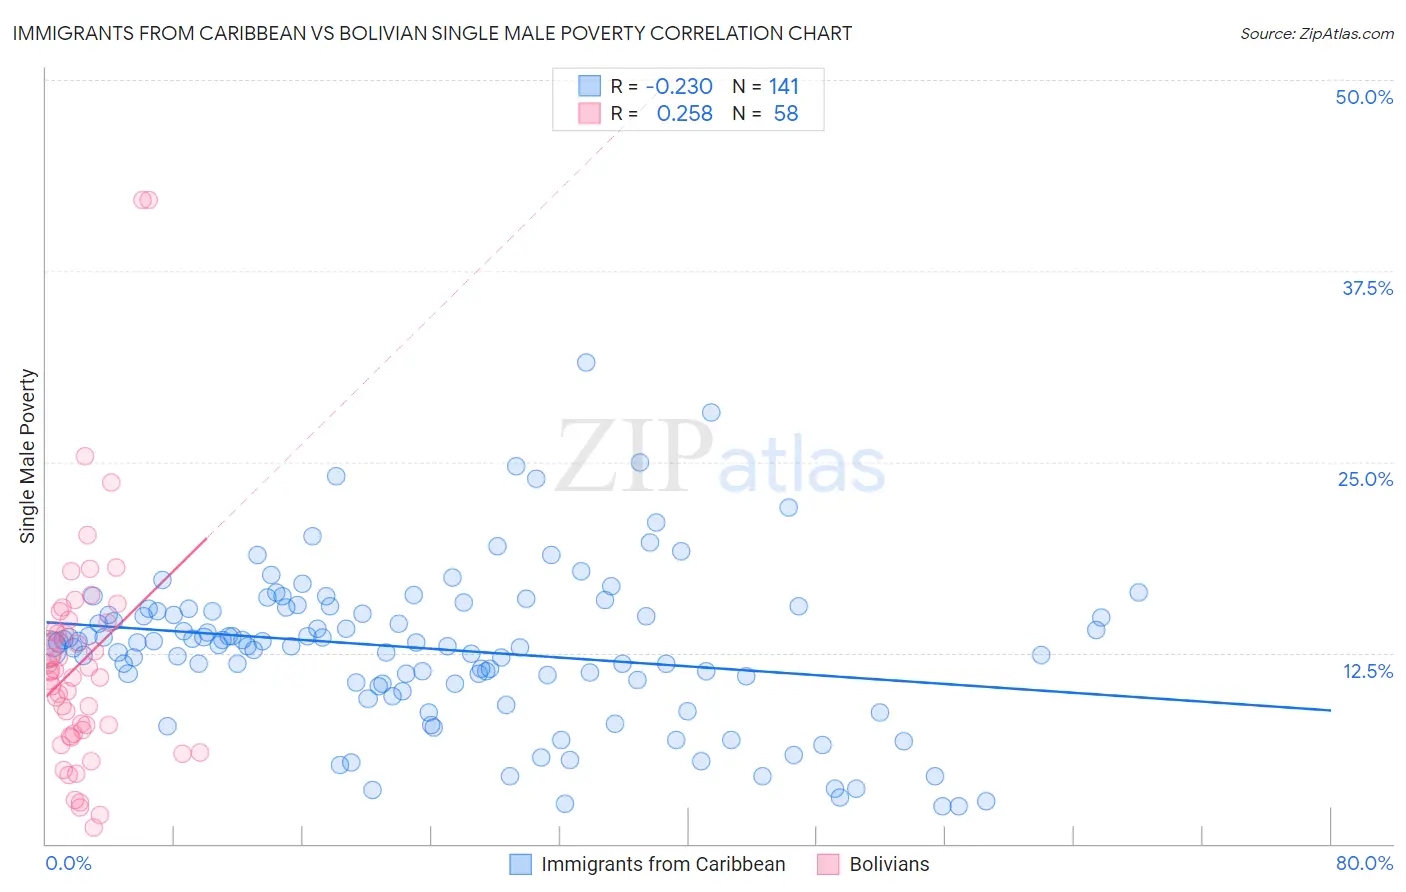
Immigrants from Caribbean vs Bolivian Single Male Poverty Correlation Chart
The statistical analysis conducted on geographies consisting of 393,892,998 people shows a weak negative correlation between the proportion of Immigrants from Caribbean and poverty level among single males in the United States with a correlation coefficient (R) of -0.230 and weighted average of 13.3%. Similarly, the statistical analysis conducted on geographies consisting of 171,550,226 people shows a weak positive correlation between the proportion of Bolivians and poverty level among single males in the United States with a correlation coefficient (R) of 0.258 and weighted average of 11.2%, a difference of 18.3%.
Single Male Poverty Correlation Summary
| Measurement | Immigrants from Caribbean | Bolivian |
| Minimum | 2.4% | 1.1% |
| Maximum | 31.5% | 42.1% |
| Range | 29.0% | 41.0% |
| Mean | 12.8% | 11.9% |
| Median | 13.0% | 11.1% |
| Interquartile 25% (IQ1) | 10.5% | 7.2% |
| Interquartile 75% (IQ3) | 15.4% | 14.5% |
| Interquartile Range (IQR) | 4.9% | 7.3% |
| Standard Deviation (Sample) | 5.1% | 7.7% |
| Standard Deviation (Population) | 5.1% | 7.6% |
Similar Demographics by Single Male Poverty
Demographics Similar to Immigrants from Caribbean by Single Male Poverty
In terms of single male poverty, the demographic groups most similar to Immigrants from Caribbean are Slavic (13.3%, a difference of 0.090%), Ghanaian (13.3%, a difference of 0.27%), British (13.3%, a difference of 0.29%), Canadian (13.3%, a difference of 0.29%), and European (13.3%, a difference of 0.30%).
| Demographics | Rating | Rank | Single Male Poverty |
| Immigrants | Denmark | 8.7 /100 | #225 | Tragic 13.2% |
| Jamaicans | 7.7 /100 | #226 | Tragic 13.2% |
| Haitians | 7.0 /100 | #227 | Tragic 13.2% |
| Lebanese | 6.6 /100 | #228 | Tragic 13.2% |
| Europeans | 6.2 /100 | #229 | Tragic 13.3% |
| Ghanaians | 6.1 /100 | #230 | Tragic 13.3% |
| Slavs | 5.3 /100 | #231 | Tragic 13.3% |
| Immigrants | Caribbean | 5.0 /100 | #232 | Tragic 13.3% |
| British | 4.0 /100 | #233 | Tragic 13.3% |
| Canadians | 4.0 /100 | #234 | Tragic 13.3% |
| Bangladeshis | 3.7 /100 | #235 | Tragic 13.3% |
| Luxembourgers | 3.6 /100 | #236 | Tragic 13.4% |
| British West Indians | 3.4 /100 | #237 | Tragic 13.4% |
| Immigrants | Ghana | 3.2 /100 | #238 | Tragic 13.4% |
| Czechoslovakians | 3.0 /100 | #239 | Tragic 13.4% |
Demographics Similar to Bolivians by Single Male Poverty
In terms of single male poverty, the demographic groups most similar to Bolivians are Indian (Asian) (11.3%, a difference of 0.20%), Immigrants from Pakistan (11.2%, a difference of 0.21%), Maltese (11.3%, a difference of 0.22%), Asian (11.2%, a difference of 0.30%), and Immigrants from Japan (11.3%, a difference of 0.55%).
| Demographics | Rating | Rank | Single Male Poverty |
| Bhutanese | 100.0 /100 | #16 | Exceptional 11.1% |
| Tsimshian | 100.0 /100 | #17 | Exceptional 11.1% |
| Immigrants | Bolivia | 100.0 /100 | #18 | Exceptional 11.1% |
| Immigrants | Moldova | 100.0 /100 | #19 | Exceptional 11.2% |
| Ethiopians | 100.0 /100 | #20 | Exceptional 11.2% |
| Asians | 100.0 /100 | #21 | Exceptional 11.2% |
| Immigrants | Pakistan | 100.0 /100 | #22 | Exceptional 11.2% |
| Bolivians | 100.0 /100 | #23 | Exceptional 11.2% |
| Indians (Asian) | 100.0 /100 | #24 | Exceptional 11.3% |
| Maltese | 100.0 /100 | #25 | Exceptional 11.3% |
| Immigrants | Japan | 100.0 /100 | #26 | Exceptional 11.3% |
| Immigrants | China | 100.0 /100 | #27 | Exceptional 11.4% |
| Immigrants | Asia | 100.0 /100 | #28 | Exceptional 11.4% |
| Immigrants | Egypt | 100.0 /100 | #29 | Exceptional 11.4% |
| Iranians | 100.0 /100 | #30 | Exceptional 11.4% |