Immigrants from Cameroon vs Immigrants from Switzerland Male Poverty
COMPARE
Immigrants from Cameroon
Immigrants from Switzerland
Male Poverty
Male Poverty Comparison
Immigrants from Cameroon
Immigrants from Switzerland
11.2%
MALE POVERTY
44.5/ 100
METRIC RATING
178th/ 347
METRIC RANK
10.8%
MALE POVERTY
79.2/ 100
METRIC RATING
137th/ 347
METRIC RANK
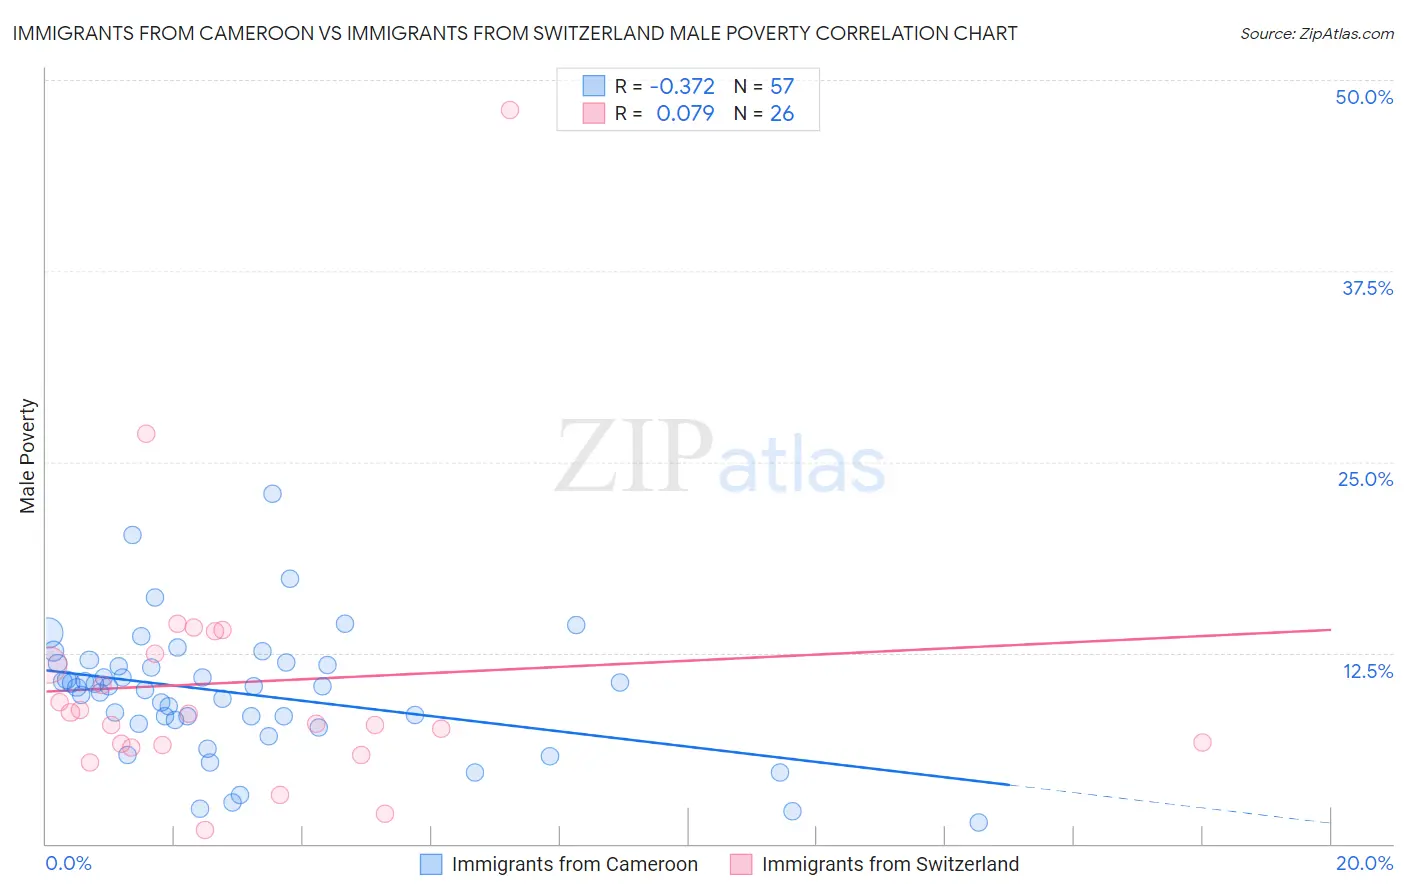
Immigrants from Cameroon vs Immigrants from Switzerland Male Poverty Correlation Chart
The statistical analysis conducted on geographies consisting of 130,706,332 people shows a mild negative correlation between the proportion of Immigrants from Cameroon and poverty level among males in the United States with a correlation coefficient (R) of -0.372 and weighted average of 11.2%. Similarly, the statistical analysis conducted on geographies consisting of 148,054,037 people shows a slight positive correlation between the proportion of Immigrants from Switzerland and poverty level among males in the United States with a correlation coefficient (R) of 0.079 and weighted average of 10.8%, a difference of 4.0%.
Male Poverty Correlation Summary
| Measurement | Immigrants from Cameroon | Immigrants from Switzerland |
| Minimum | 1.4% | 0.91% |
| Maximum | 22.9% | 48.0% |
| Range | 21.5% | 47.1% |
| Mean | 9.8% | 10.6% |
| Median | 10.3% | 8.2% |
| Interquartile 25% (IQ1) | 8.0% | 6.5% |
| Interquartile 75% (IQ3) | 11.7% | 12.5% |
| Interquartile Range (IQR) | 3.8% | 6.0% |
| Standard Deviation (Sample) | 4.1% | 9.2% |
| Standard Deviation (Population) | 4.1% | 9.0% |
Similar Demographics by Male Poverty
Demographics Similar to Immigrants from Cameroon by Male Poverty
In terms of male poverty, the demographic groups most similar to Immigrants from Cameroon are Lebanese (11.2%, a difference of 0.11%), Immigrants from Fiji (11.2%, a difference of 0.15%), Celtic (11.2%, a difference of 0.29%), Immigrants from Syria (11.3%, a difference of 0.43%), and Immigrants from Morocco (11.3%, a difference of 0.44%).
| Demographics | Rating | Rank | Male Poverty |
| Uruguayans | 51.0 /100 | #171 | Average 11.2% |
| Immigrants | Ethiopia | 50.7 /100 | #172 | Average 11.2% |
| Pennsylvania Germans | 50.5 /100 | #173 | Average 11.2% |
| Immigrants | Oceania | 50.0 /100 | #174 | Average 11.2% |
| Celtics | 47.5 /100 | #175 | Average 11.2% |
| Immigrants | Fiji | 46.0 /100 | #176 | Average 11.2% |
| Lebanese | 45.6 /100 | #177 | Average 11.2% |
| Immigrants | Cameroon | 44.5 /100 | #178 | Average 11.2% |
| Immigrants | Syria | 40.3 /100 | #179 | Average 11.3% |
| Immigrants | Morocco | 40.1 /100 | #180 | Average 11.3% |
| Immigrants | Costa Rica | 39.5 /100 | #181 | Fair 11.3% |
| Mongolians | 39.0 /100 | #182 | Fair 11.3% |
| Kenyans | 38.4 /100 | #183 | Fair 11.3% |
| Immigrants | South America | 36.9 /100 | #184 | Fair 11.3% |
| Immigrants | Afghanistan | 33.3 /100 | #185 | Fair 11.4% |
Demographics Similar to Immigrants from Switzerland by Male Poverty
In terms of male poverty, the demographic groups most similar to Immigrants from Switzerland are Yugoslavian (10.8%, a difference of 0.15%), Immigrants from Israel (10.8%, a difference of 0.26%), Immigrants from Jordan (10.8%, a difference of 0.27%), Tlingit-Haida (10.9%, a difference of 0.46%), and Immigrants from France (10.9%, a difference of 0.49%).
| Demographics | Rating | Rank | Male Poverty |
| Chileans | 83.9 /100 | #130 | Excellent 10.7% |
| Immigrants | Belarus | 83.3 /100 | #131 | Excellent 10.7% |
| Immigrants | Vietnam | 83.0 /100 | #132 | Excellent 10.8% |
| Pakistanis | 83.0 /100 | #133 | Excellent 10.8% |
| New Zealanders | 82.9 /100 | #134 | Excellent 10.8% |
| Brazilians | 82.7 /100 | #135 | Excellent 10.8% |
| Immigrants | Israel | 80.9 /100 | #136 | Excellent 10.8% |
| Immigrants | Switzerland | 79.2 /100 | #137 | Good 10.8% |
| Yugoslavians | 78.2 /100 | #138 | Good 10.8% |
| Immigrants | Jordan | 77.5 /100 | #139 | Good 10.8% |
| Tlingit-Haida | 76.1 /100 | #140 | Good 10.9% |
| Immigrants | France | 75.8 /100 | #141 | Good 10.9% |
| Basques | 74.6 /100 | #142 | Good 10.9% |
| Afghans | 71.9 /100 | #143 | Good 10.9% |
| Samoans | 71.8 /100 | #144 | Good 10.9% |